
Europe

Marketing Communication. Capital at risk. For Professional Investors Only. Please read fund legal documentation before making any final investment decisions.
The Second-Order Effects: Where Capex Lands Beyond Tech
Bottom Line
Going into 2026, a key question was how resilient hyperscaler capital expenditure would prove to be, and therefore how long the companies downstream of it could keep benefiting. The first half of 2026 tested the robustness of this capital flow and, despite threats, the spending has continued and projections have risen.¹
Crucially, the downstream consists of more than just semiconductors, and goes all the way to grid infrastructure, energy systems and metals that feed them, systems that have also been challenged by the Middle East conflict.² This has highlighted the benefit of reducing reliance on fossil fuels, and consequently renewables’ position has strengthened, increasingly framed as an economic imperative, rather than an ESG satisfier.³
Both of the above have profound implications for natural resources equities and energy-enablers across time horizons, most acutely industrial metals whose fundamentals have improved as demand has accelerated whilst supply growth remains subdued.⁴
Capital-intensive cycles don’t come without risk, however, and high stock-bond correlations and valuations have magnified the need for diversified hedges.⁵ Options-based hedged products are built for these conditions, with explicit downside protection combined with upside participation.
Discussed below:
Thematics
AI is nothing without infrastructure, and the infrastructure is nothing without power. H1 demonstrated that power is becoming a key bottleneck: Microsoft disclosed an Azure backlog worth tens of billions of dollars that it cannot fulfil because of power constraints⁶, while grid interconnection queues in key US markets now run to four years or more.⁷ The International Energy Agency (IEA) estimates that around a fifth of global data centre investment is at risk of delay because of grid bottlenecks.⁸
Relieving that constraint requires capital, and US utilities have announced aggregate capital programmes of close to $1.3tn for 2026 to 2030, with the increase attributed explicitly to data centre load, transmission and grid modernisation.⁹ This has direct implications for the grid developers that sit downstream of this wave of investment.
Figure 1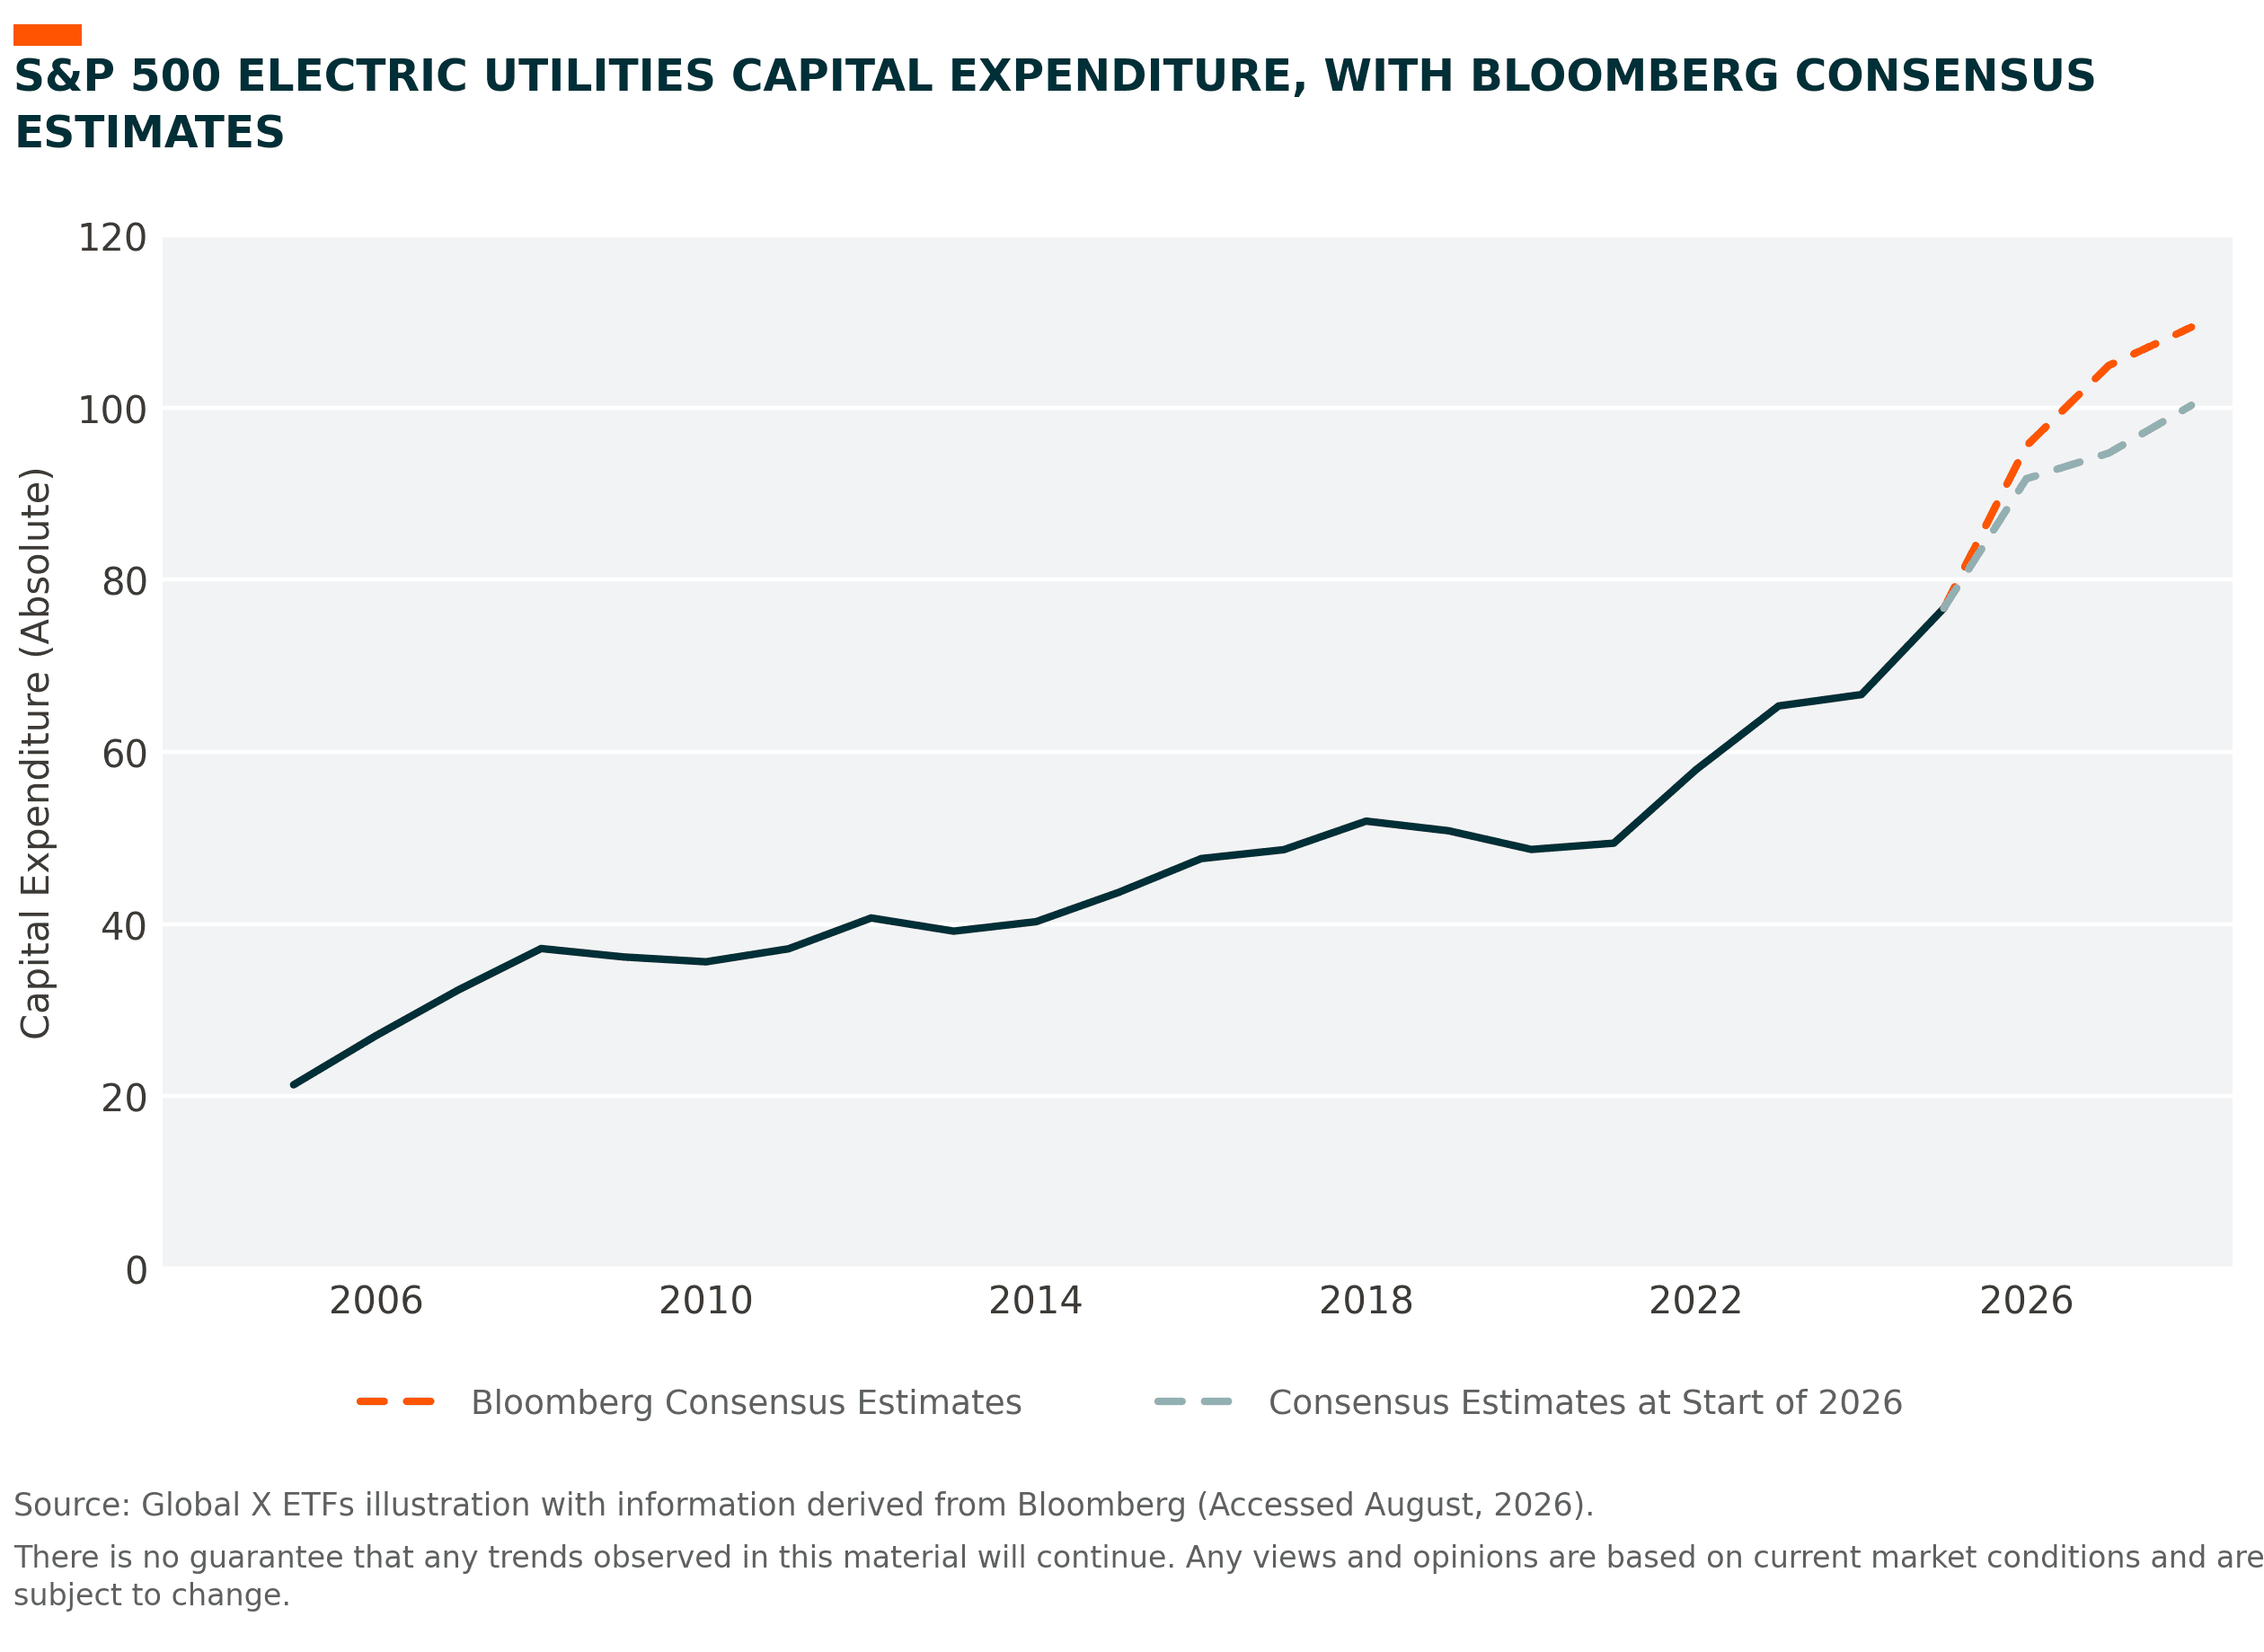
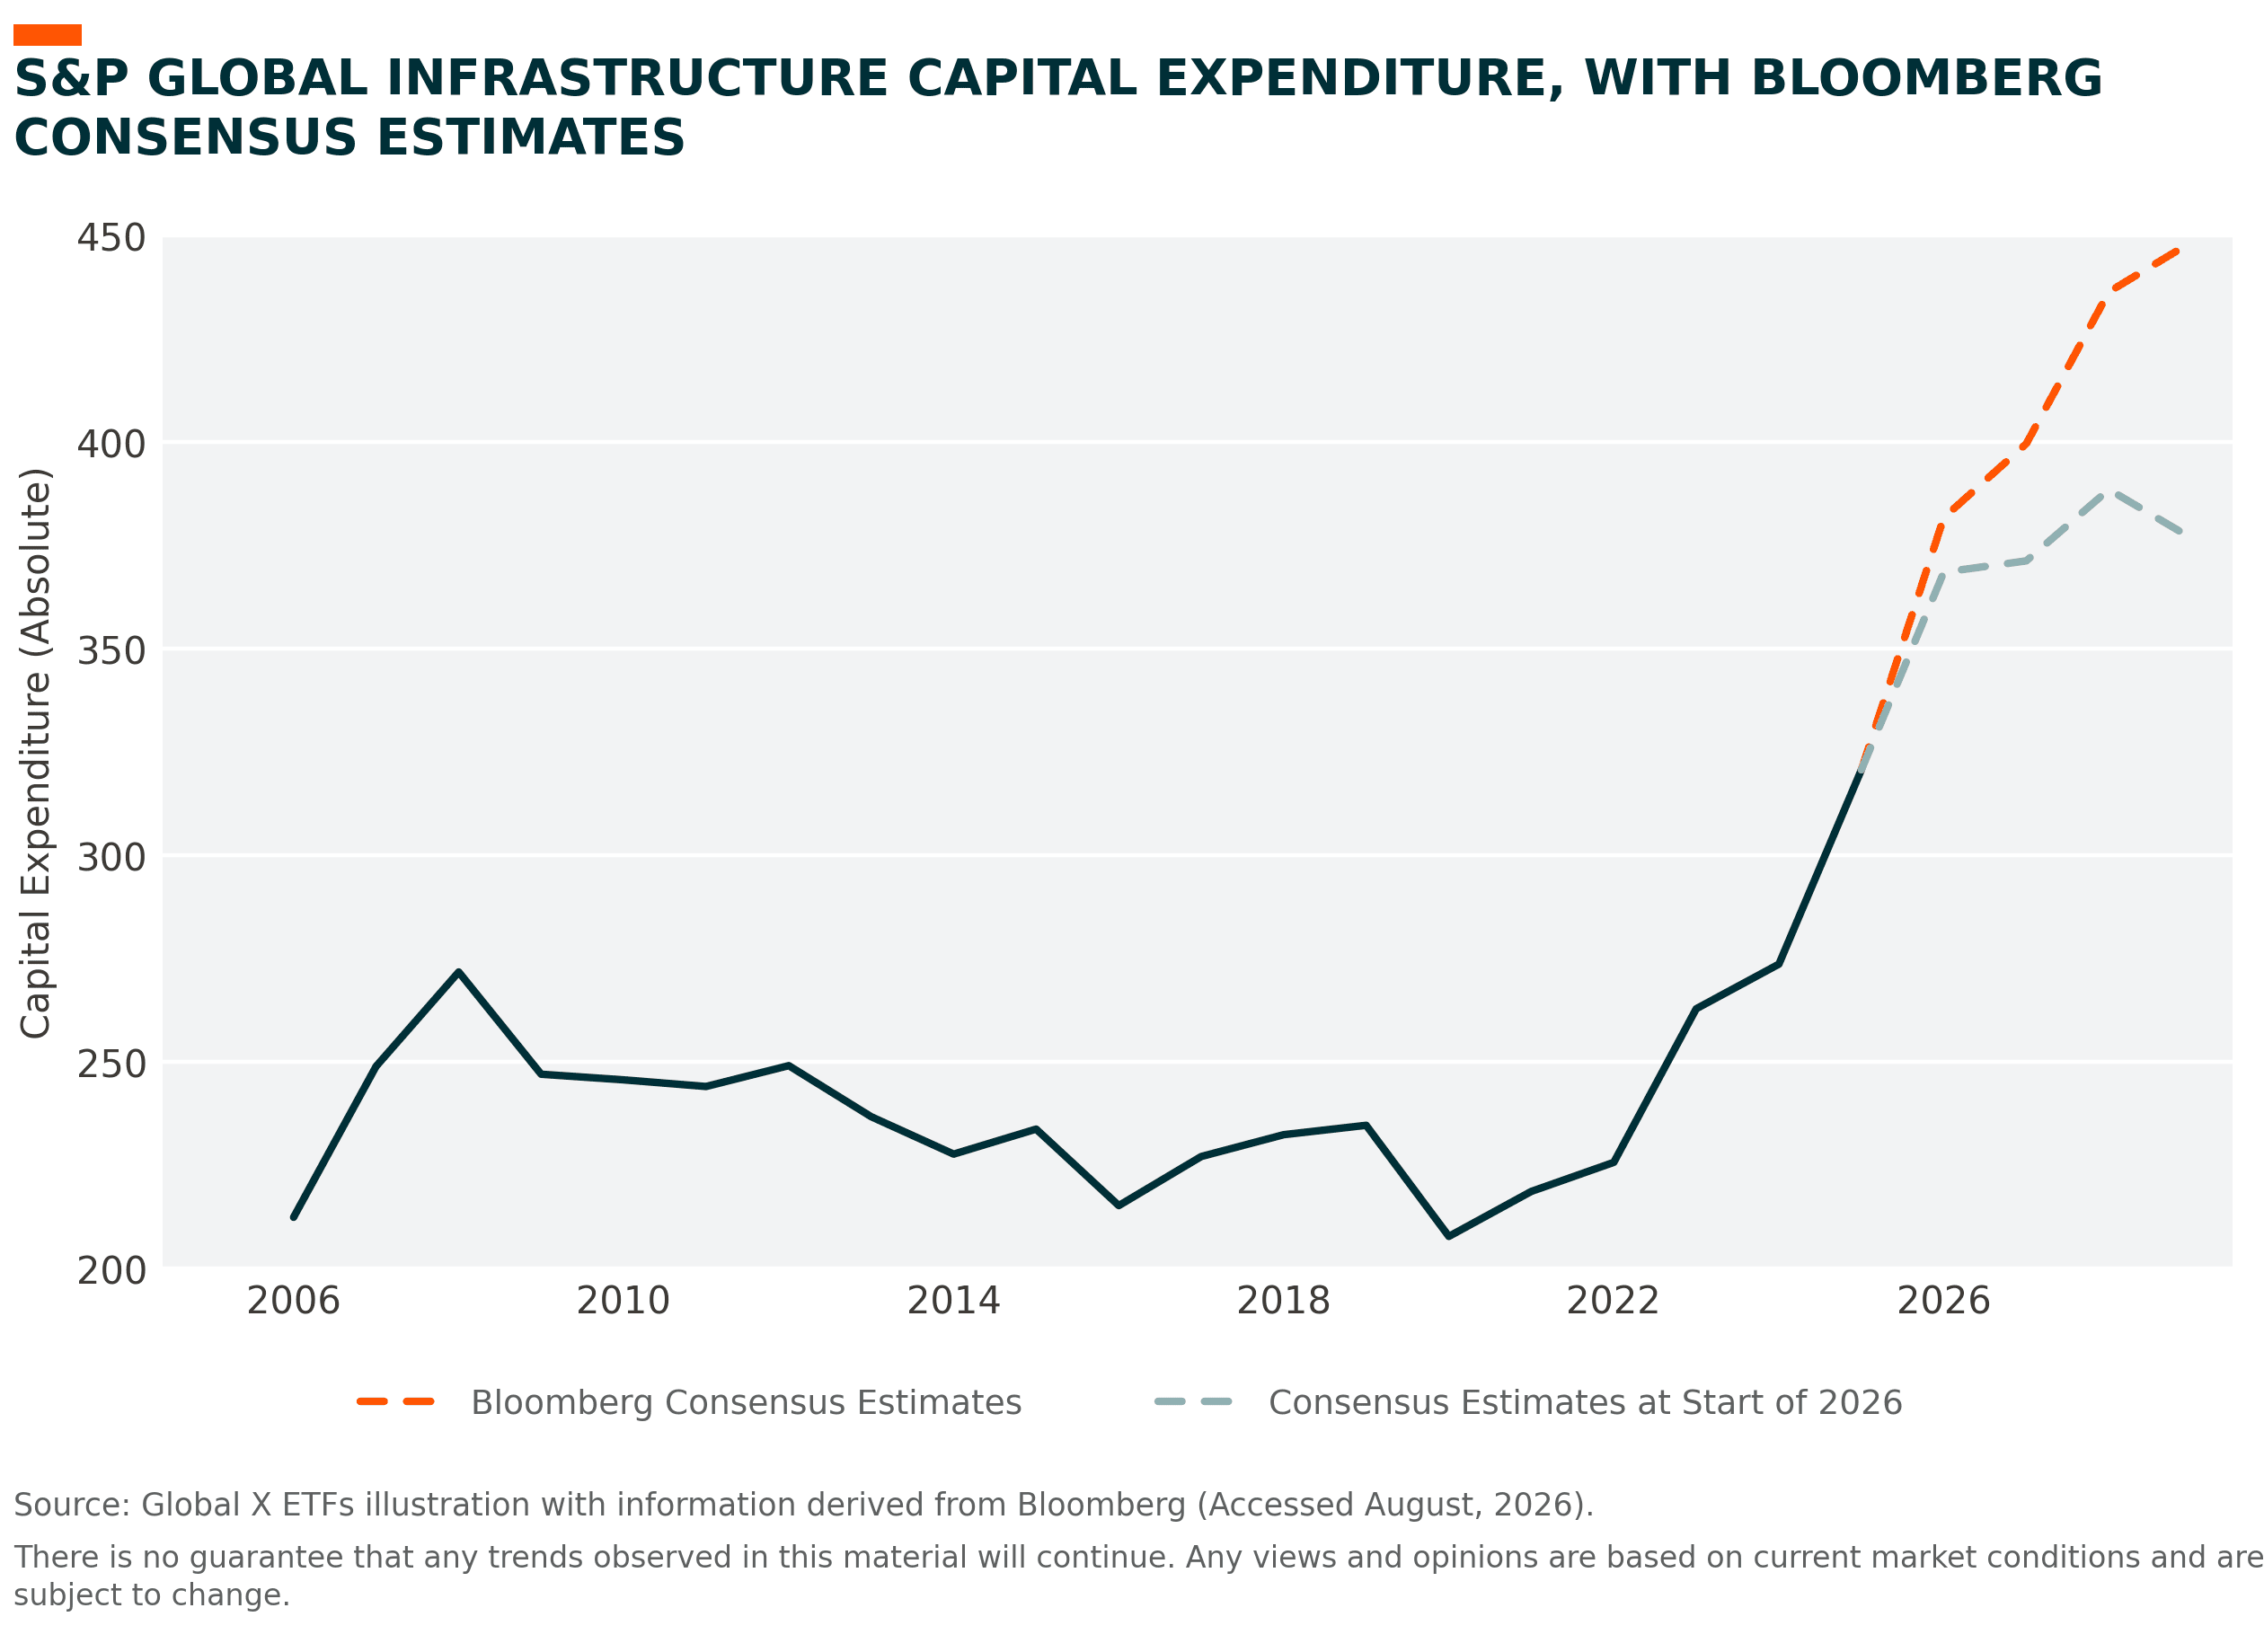
The sources of capital are also broadening. After years of subdued investment in conventional infrastructure, roads, bridges and transport networks among them, general infrastructure spending is turning a corner across the US, Europe and emerging markets alike.¹⁰ The cycle feeding the developers is therefore not an AI story alone; the AI build-out has arrived on top of a conventional infrastructure cycle that was already turning.
The most direct beneficiaries are the infrastructure development companies, whose revenues are, explicitly, infrastructure companies’ capex.¹¹ This is what separates them from pure-play infrastructure equities: owners and operators earn only once an asset is functional, whereas the developers are the destination of the spend itself, which makes them direct and near-term recipients of the capital flow.¹² That flow inflected upwards after a subdued post-GFC period, and has continued to gather velocity and magnitude year to date.¹³
Figure 2:
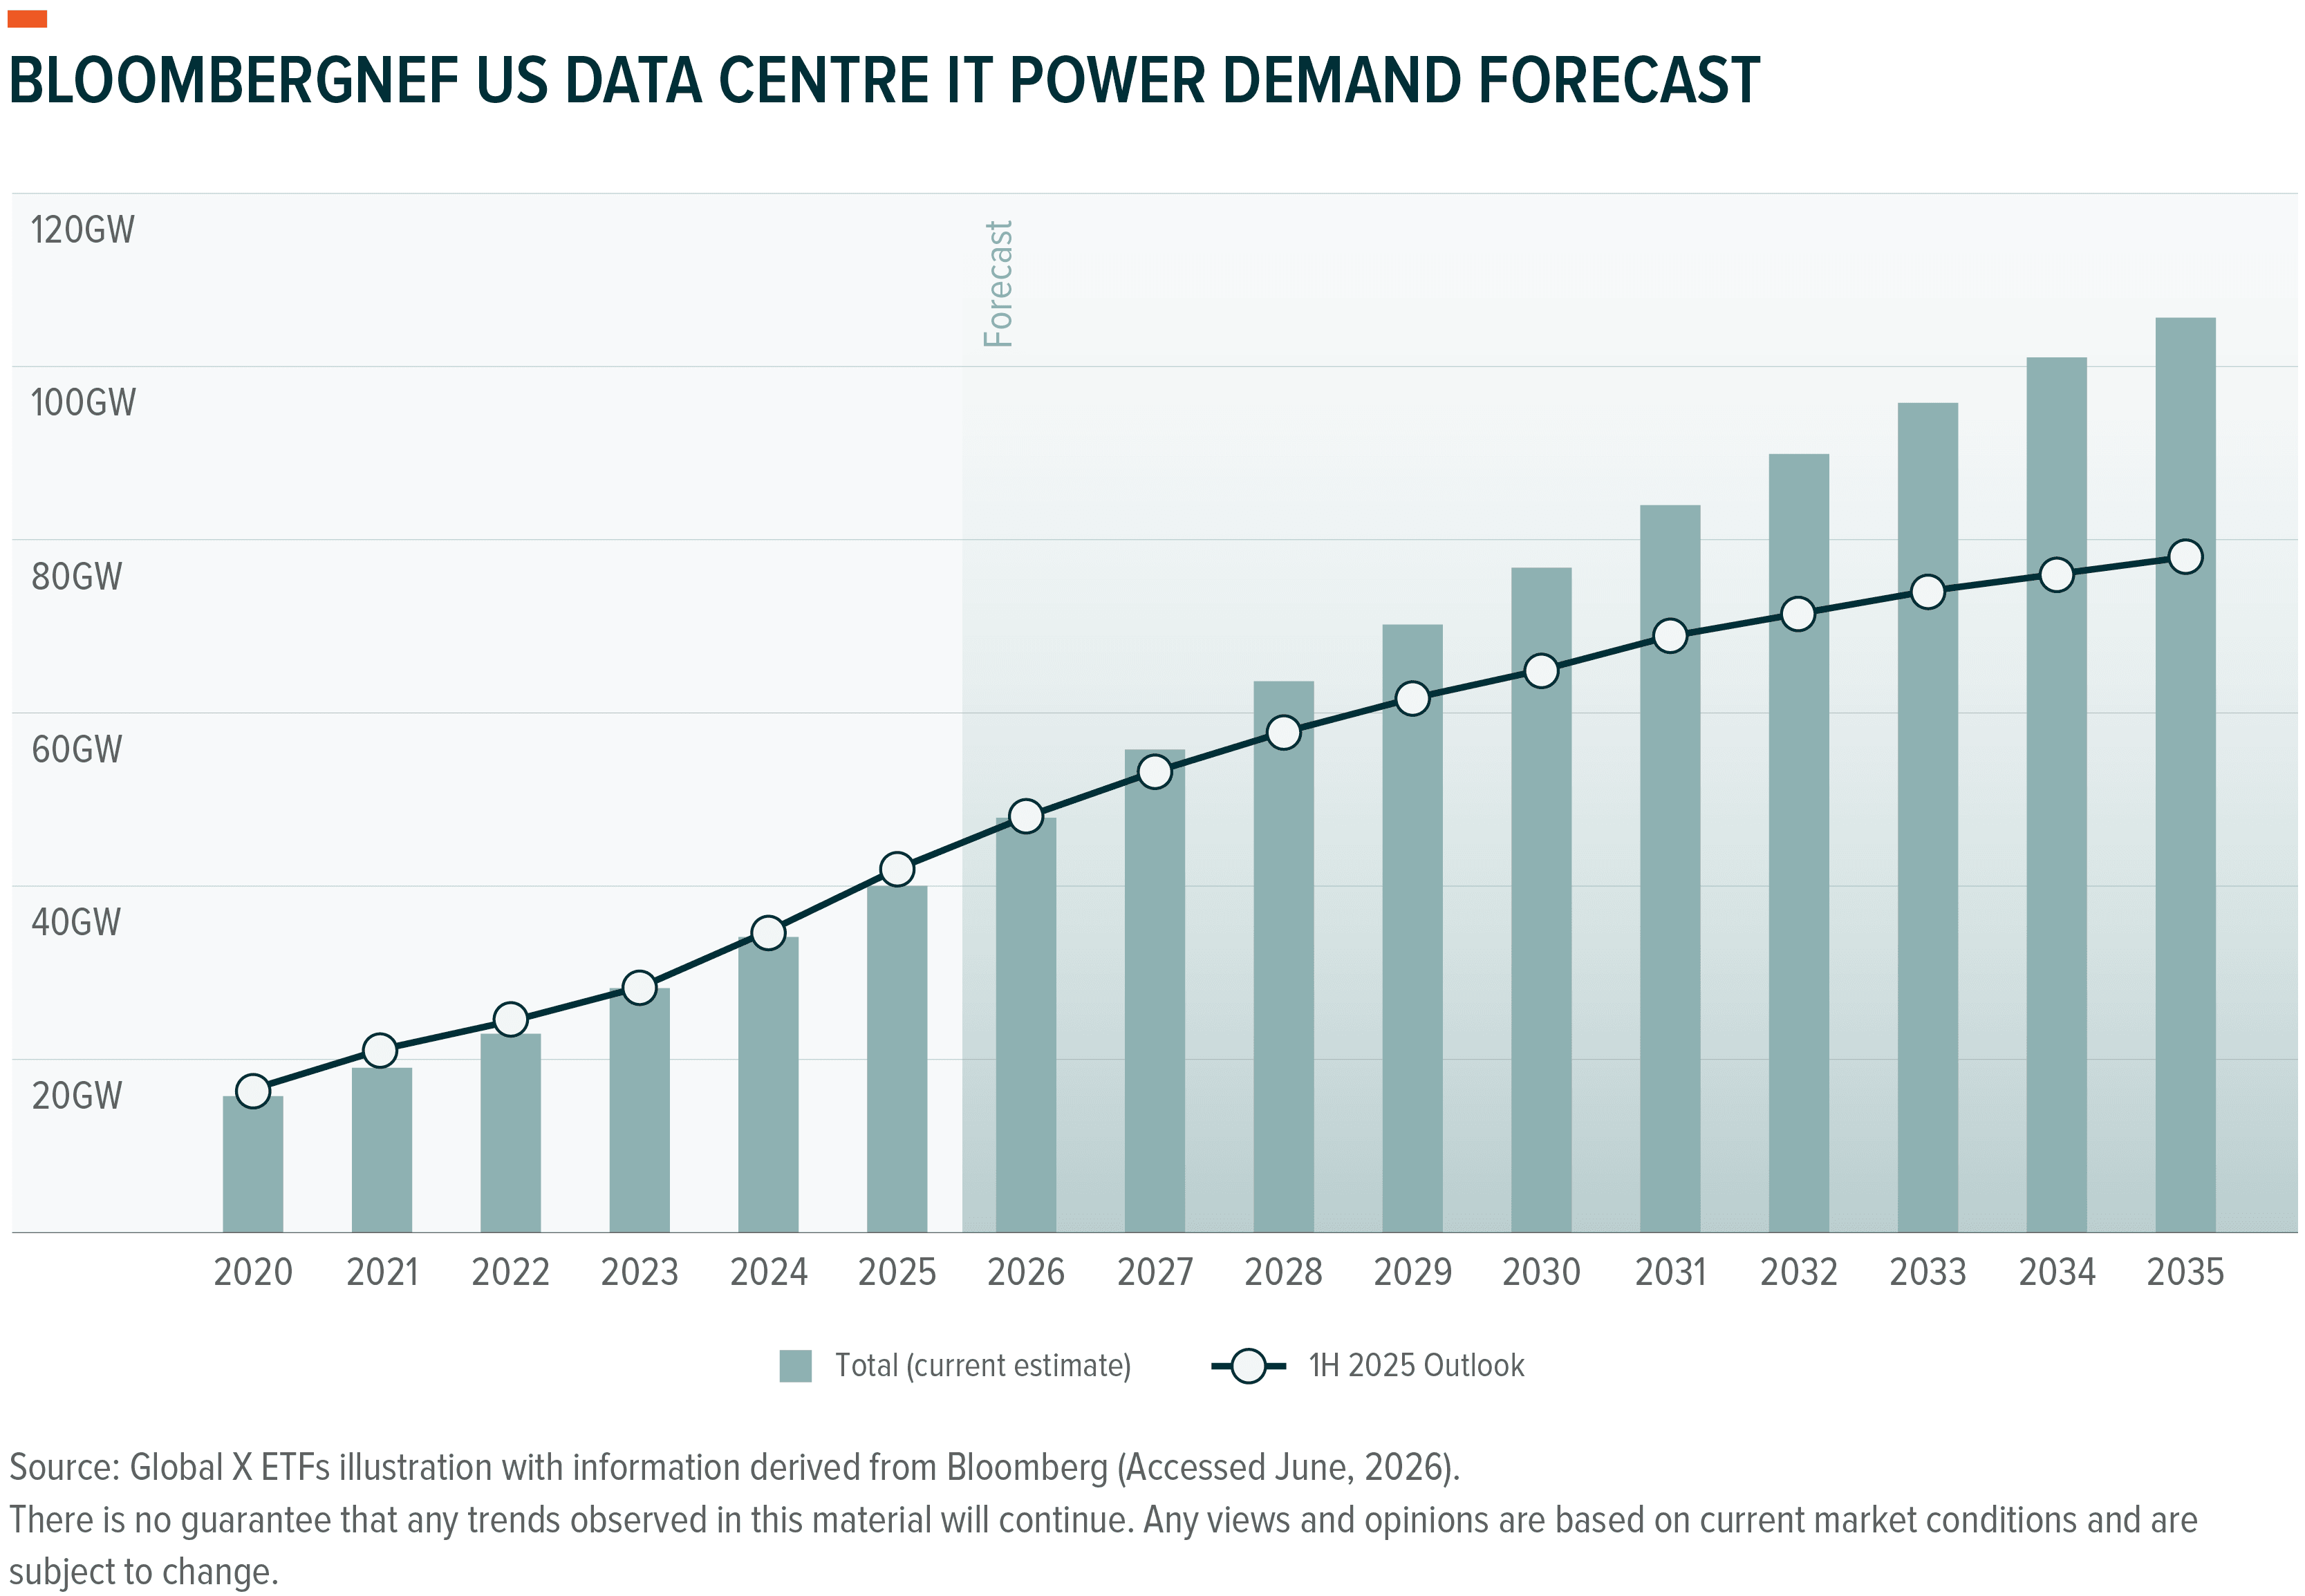
Figure 3:
US and European infrastructure development equities sit directly downstream of this cycle, and increasingly that is translating into strong momentum in bottom-line earnings and free cash flow expectations.¹⁴
Figure 4:
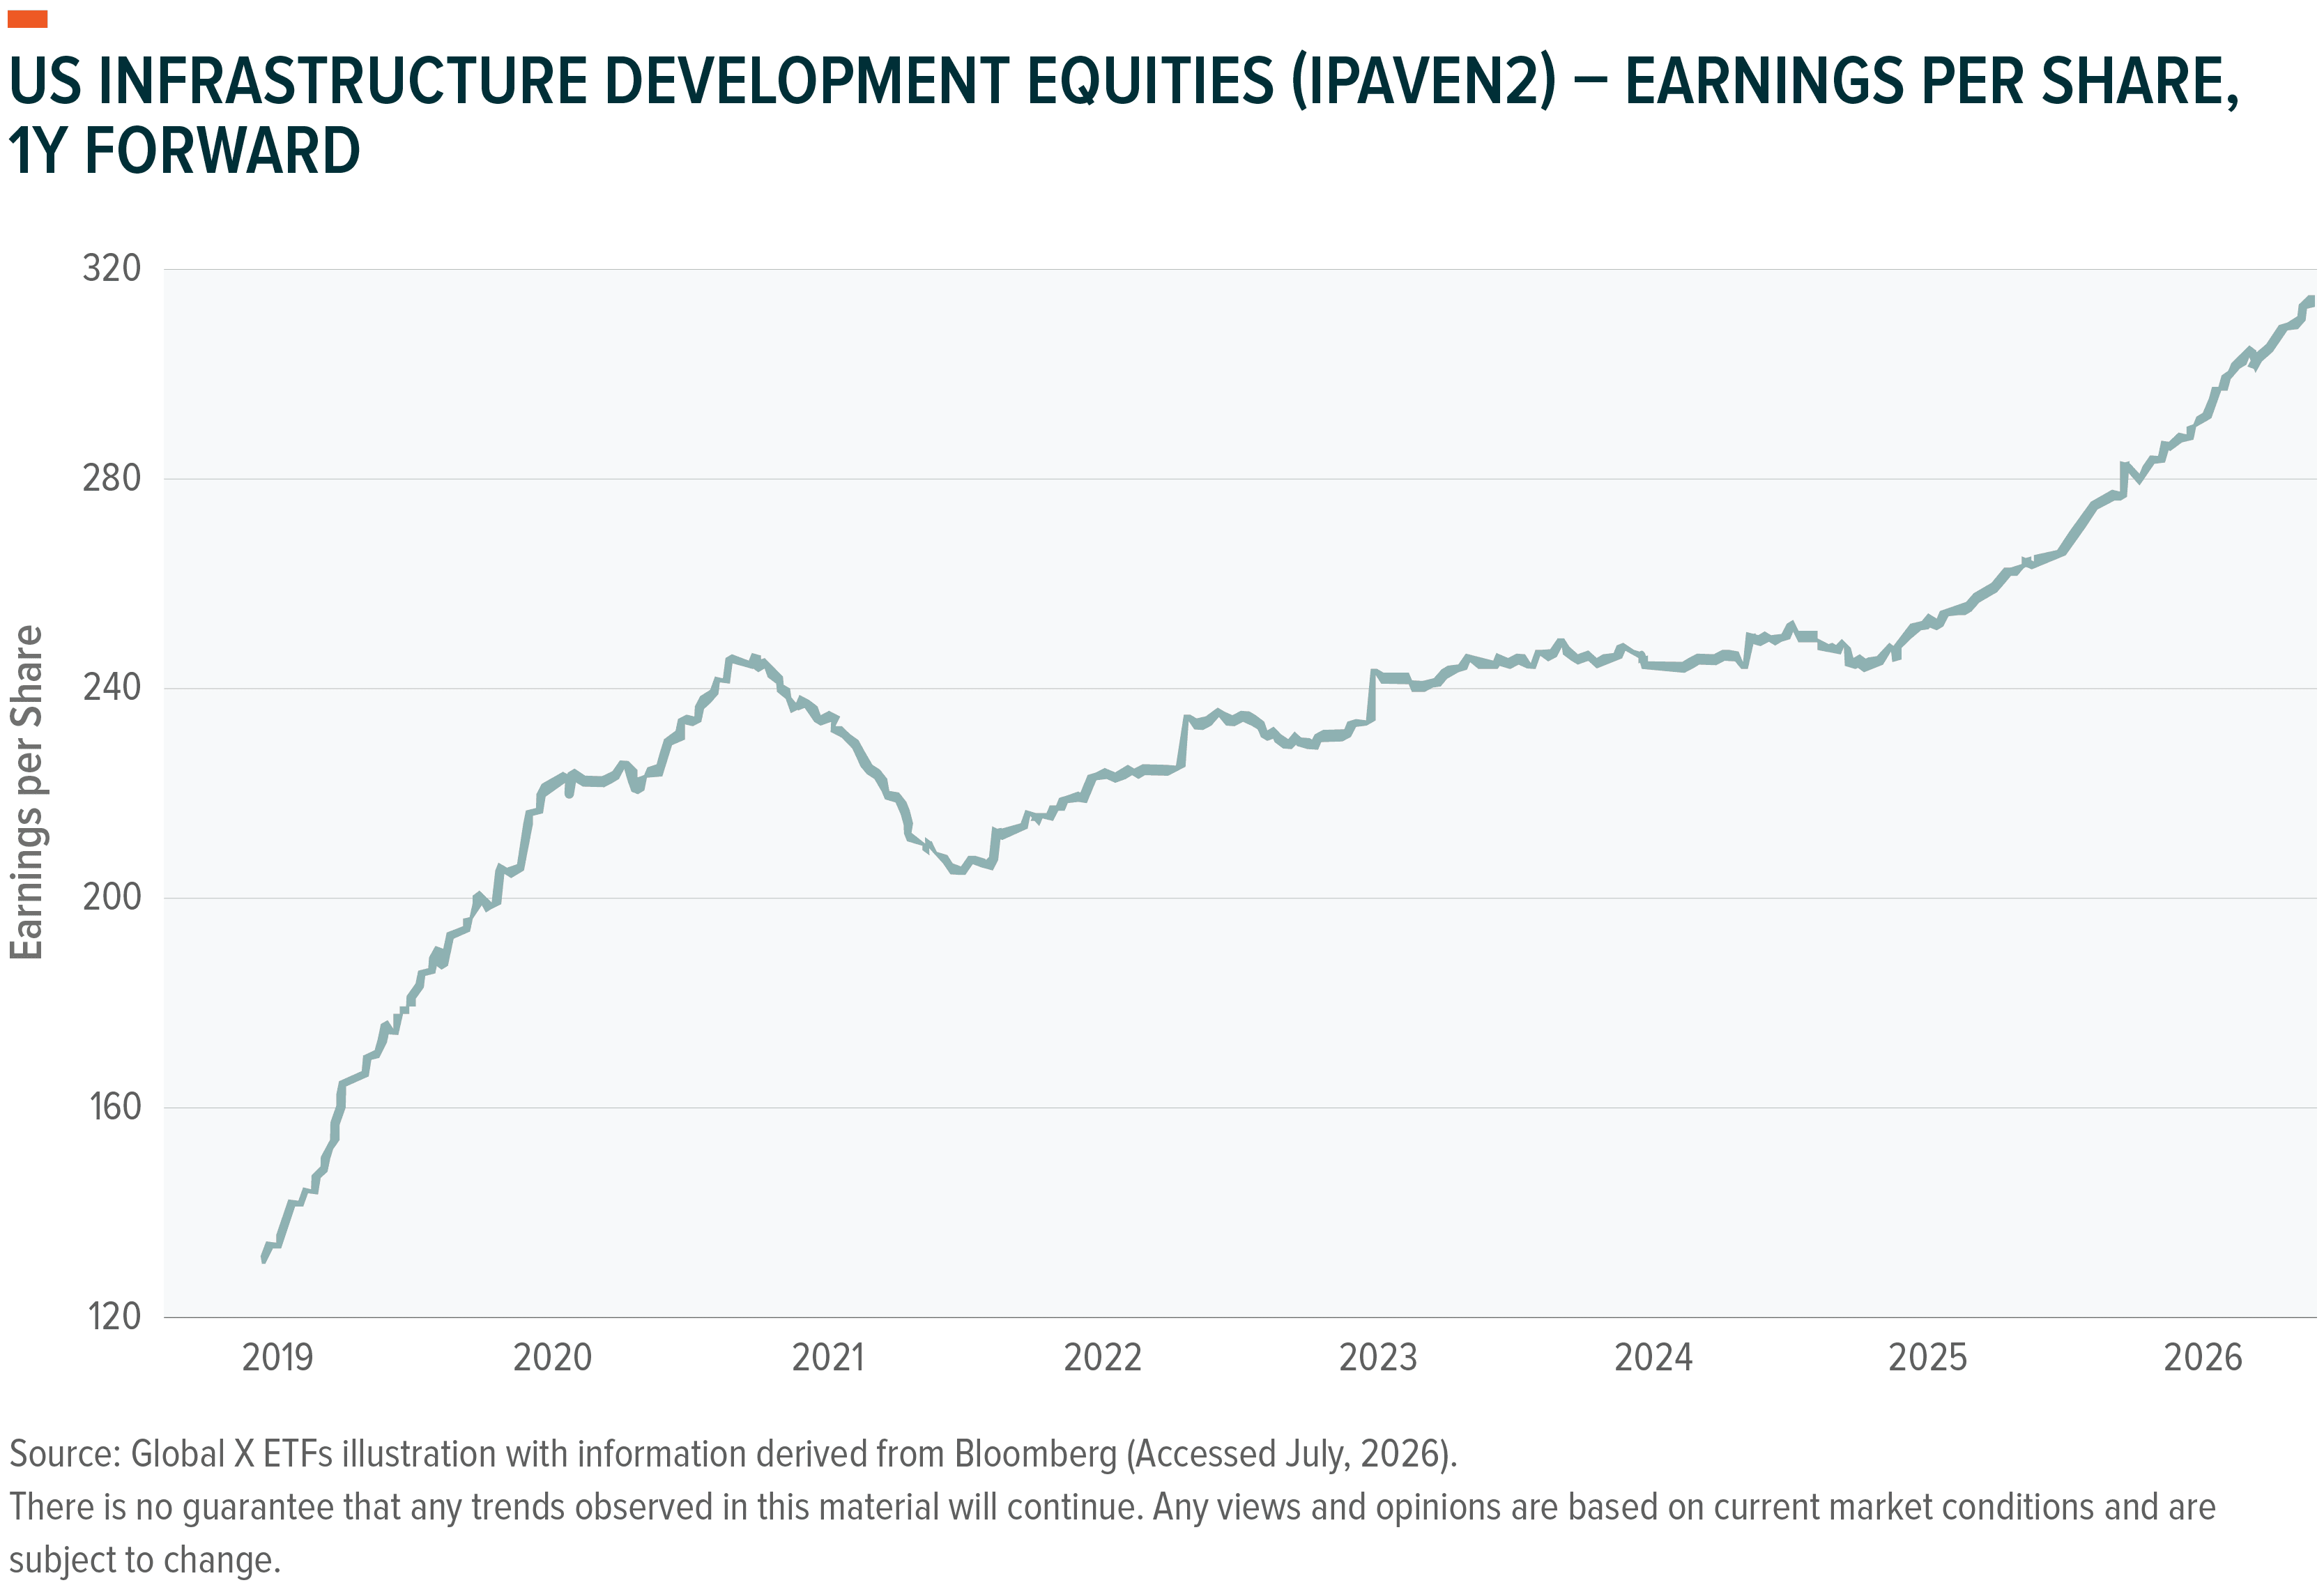
Infrastructure development contracts are long-duration assets, typically spanning decades, so when contracts land, the earnings they bring are long-term and acyclical.¹⁵
Commodities
Capital expenditure in AI has a multiplier effect on commodities. Data centres are metals-intensive in their own right, but the grid infrastructure they require to operate is markedly more metals-intensive.¹⁶ The acceleration in capex from these two sectors, therefore, is relevant for the associated metals, predominantly copper and silver.¹⁷ Broader electrification and heightened EV demand add to that structural, long-duration demand.¹⁸
The Iran conflict has strengthened the case for reducing reliance on fossil fuels, and renewables deployment has accelerated across both developed and emerging markets as a result, widening the breadth and magnitude of demand further.¹⁹ The metals therefore sit downstream of various sectors’ capex at once, utilities, hyperscalers and infrastructure among them, rather than relying on data centre construction alone.
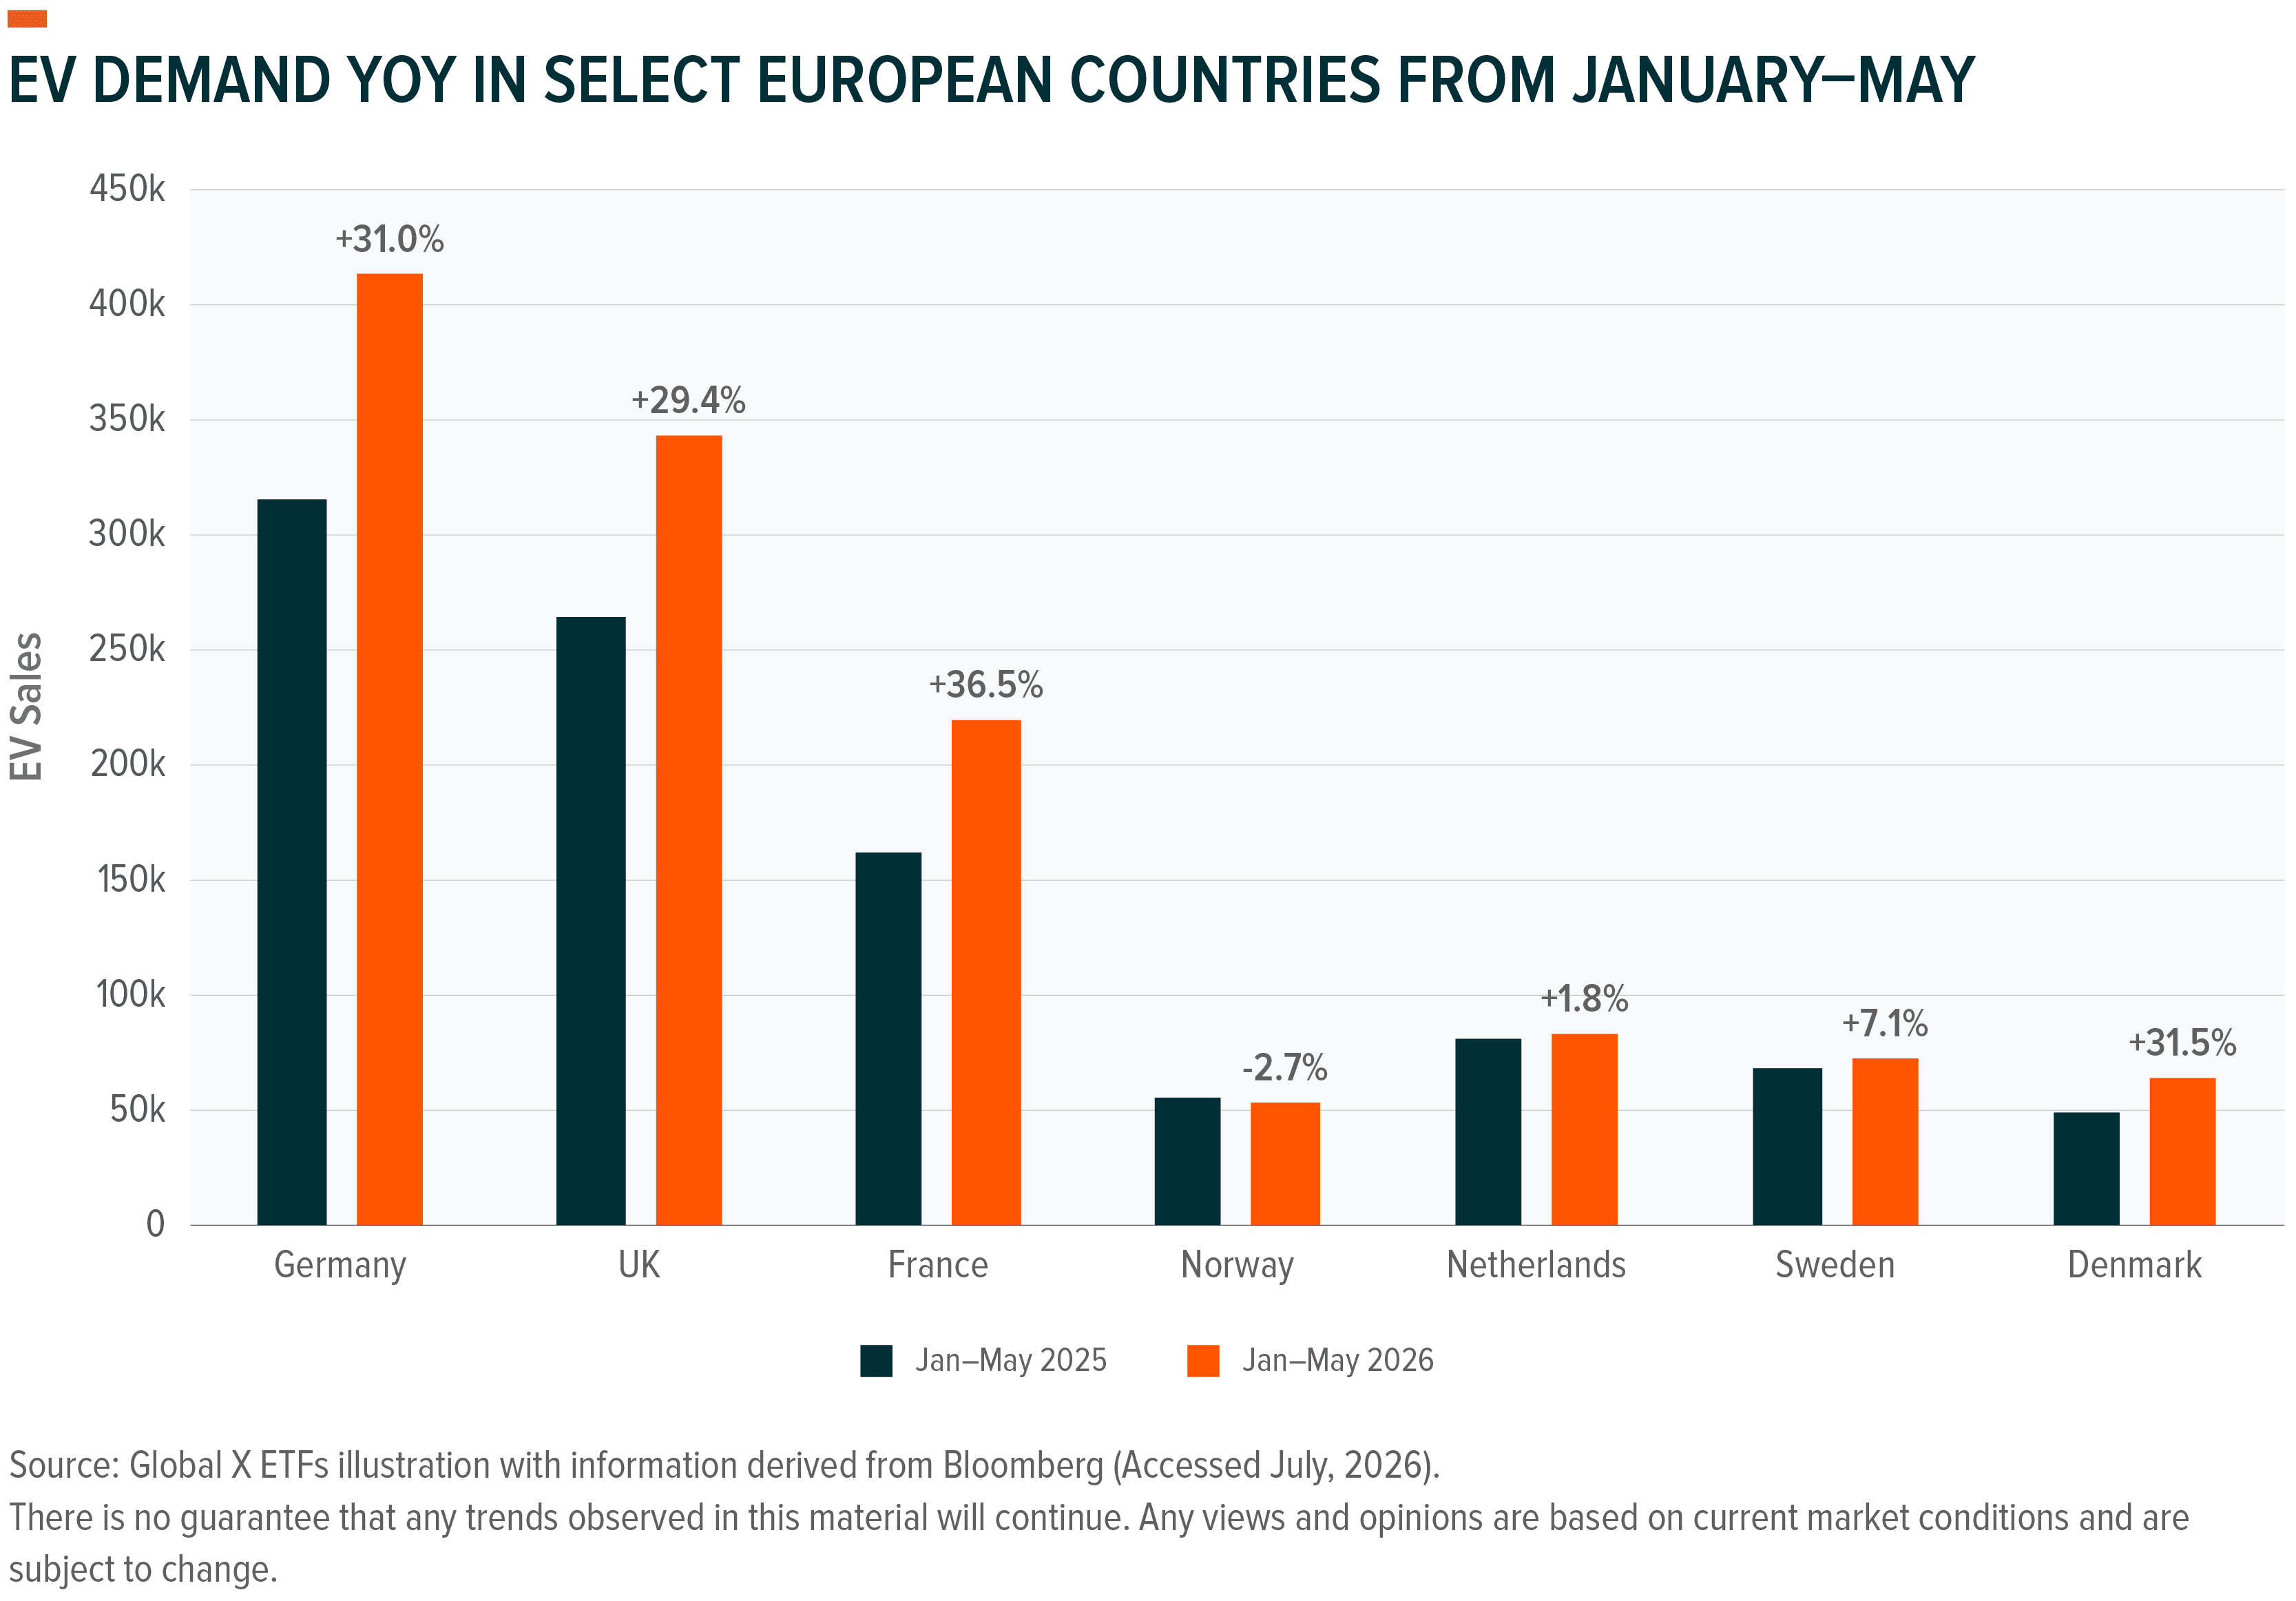
Battery and therefore lithium demand have benefitted from a continuation of the trend to scale renewables as a way to meet rising short-term power demand.²⁰ As a reminder, to manage renewables’ inherent intermittency, utilities pair generation with Battery Energy Storage Systems (BESS), therefore implicating battery installations in the value chain.²¹ Further to this, the spike in EV demand in developed economies, seemingly in reaction to the rise in fossil fuel prices, adds pressure from a different direction.²²
Figure 5
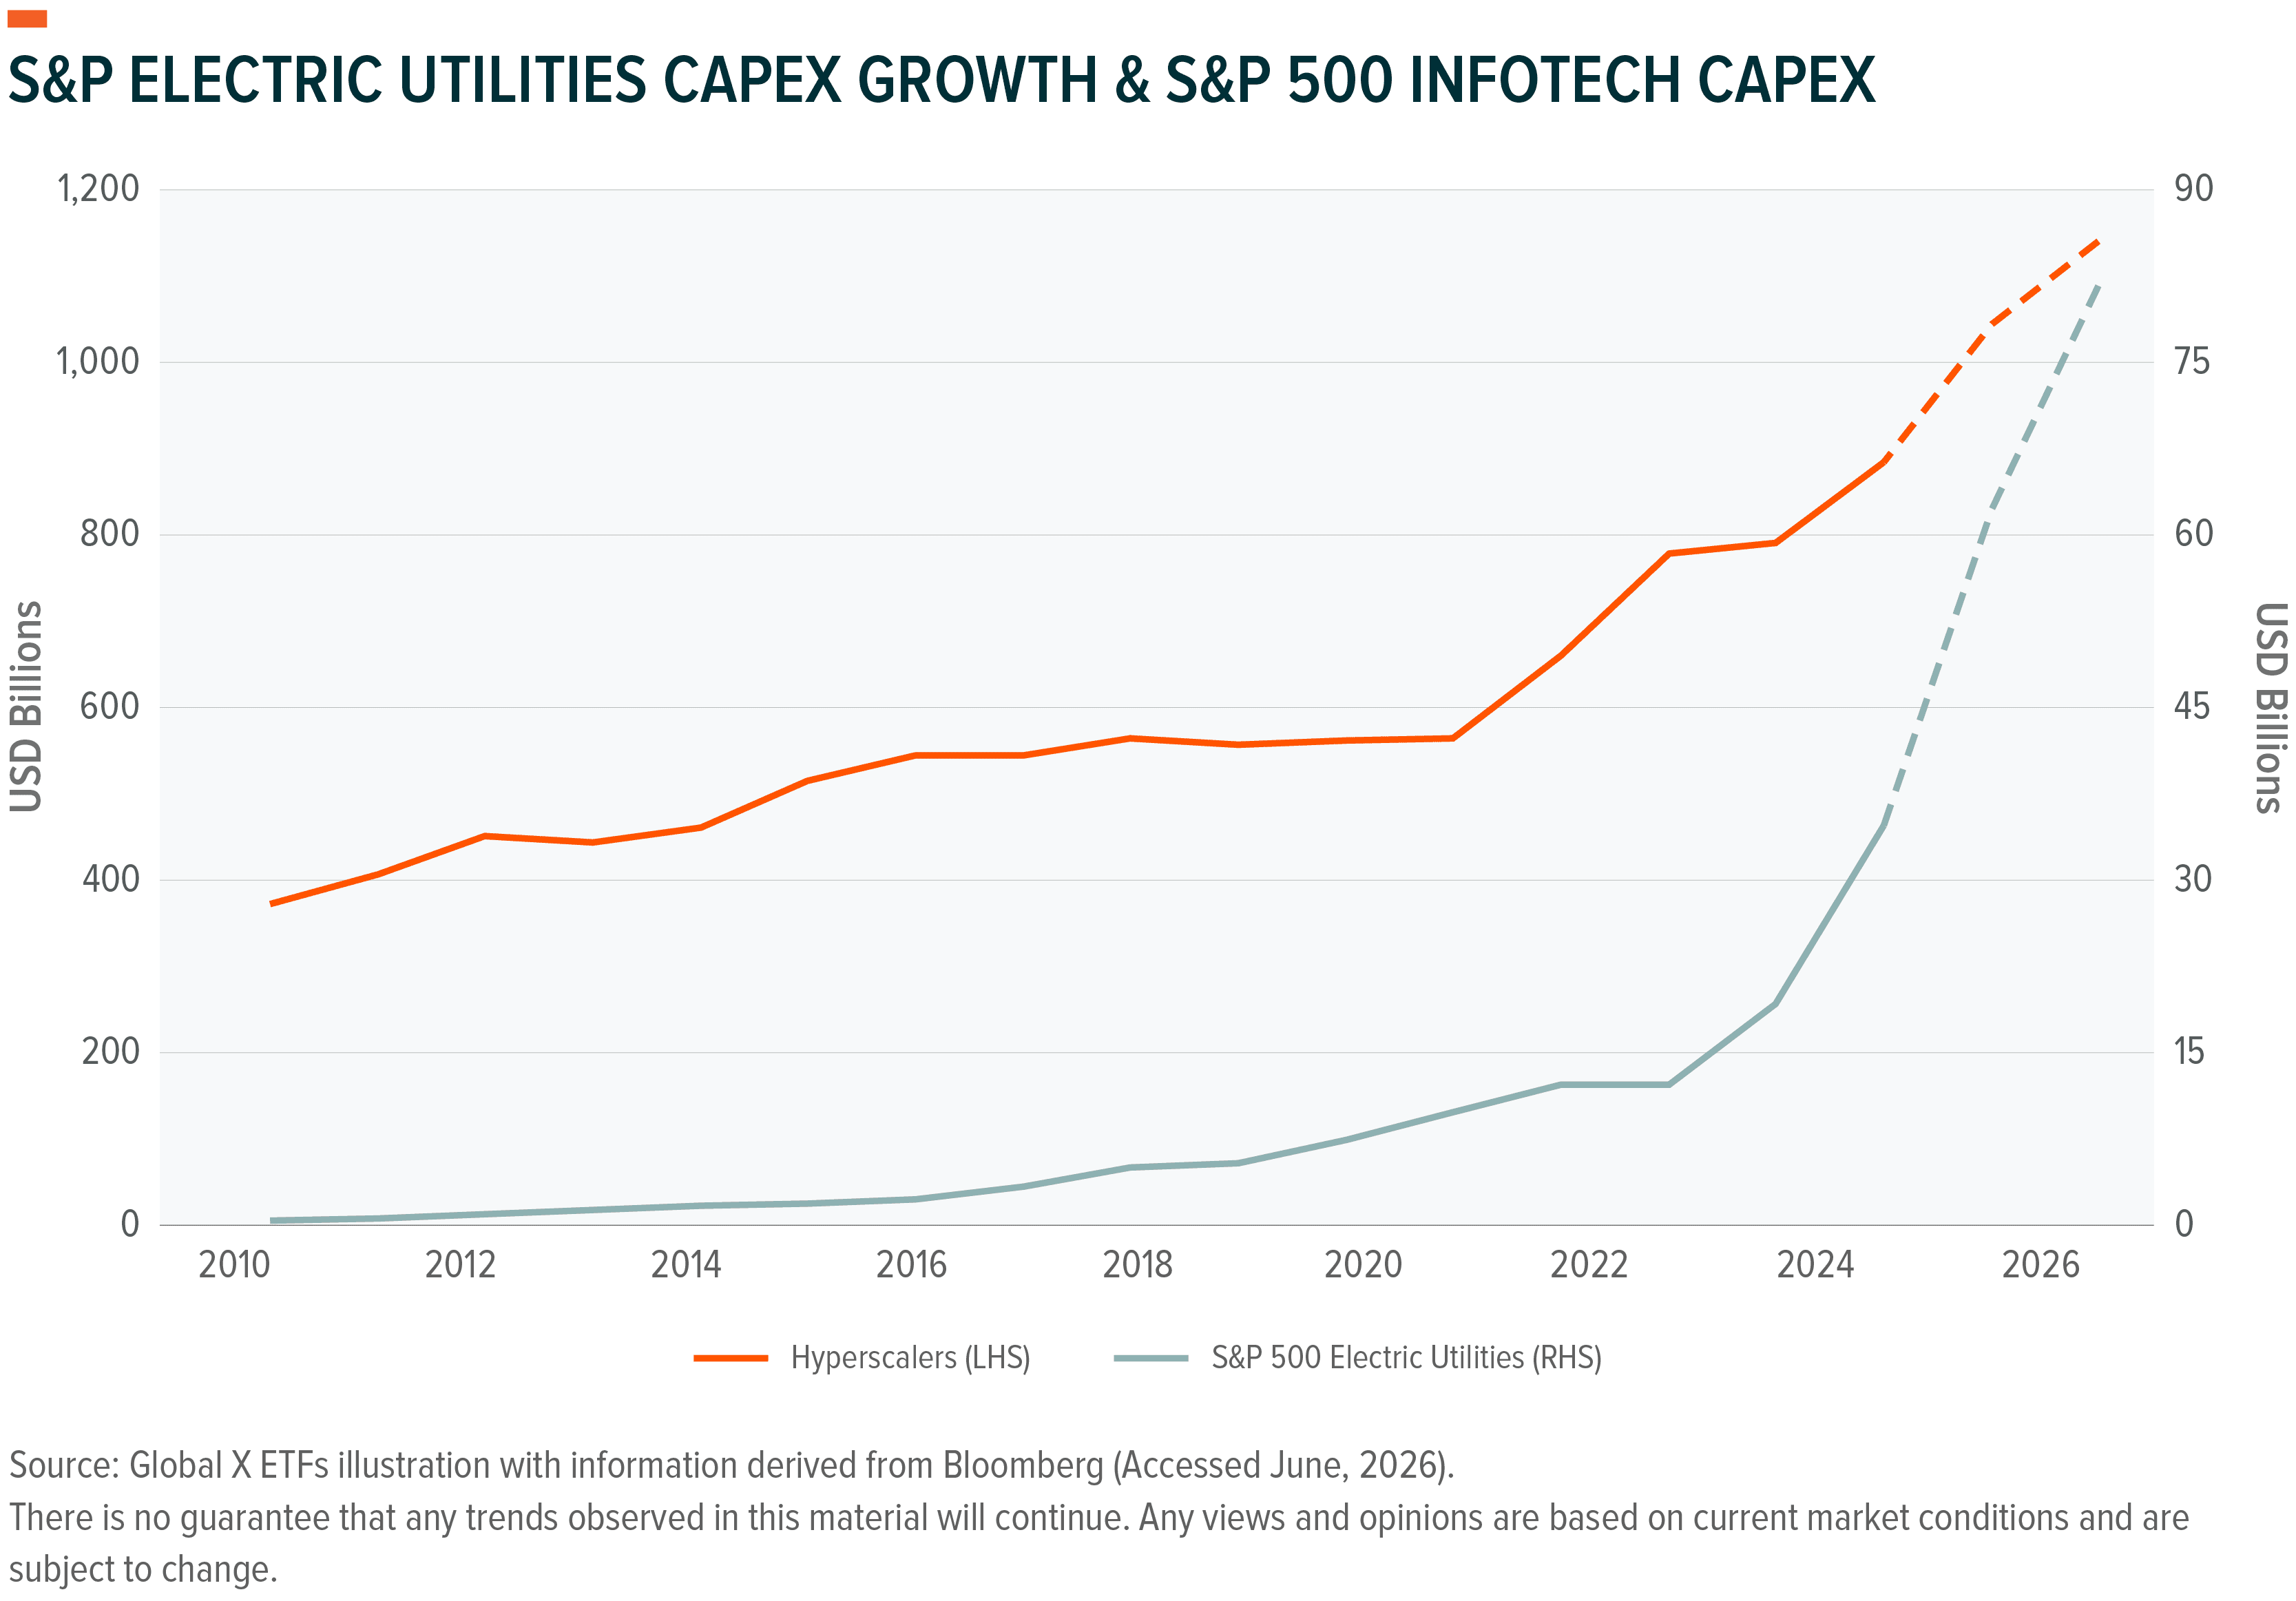
Figure 6:
Monetary conditions moved against precious metals in the first half as rate expectations rose, yet copper, more representative of the industrial cycle, held near record levels despite the adverse rates environment and a geopolitical shock that hit demand expectations across industrial commodities, with Chinese buyers stepping in on the dips.²³ This is somewhat surprising in context, but speaks to the market’s consideration of the fundamentals: demand has remained robust and supply growth is subdued.²⁴
That resilience reads directly across to silver, where roughly half of demand is industrial.²⁵ Price pressure from the monetary side has obscured what the physical market shows, namely sustained industrial buying, most visible in Chinese import volumes that held up through the half whilst investment flows cooled.²⁶
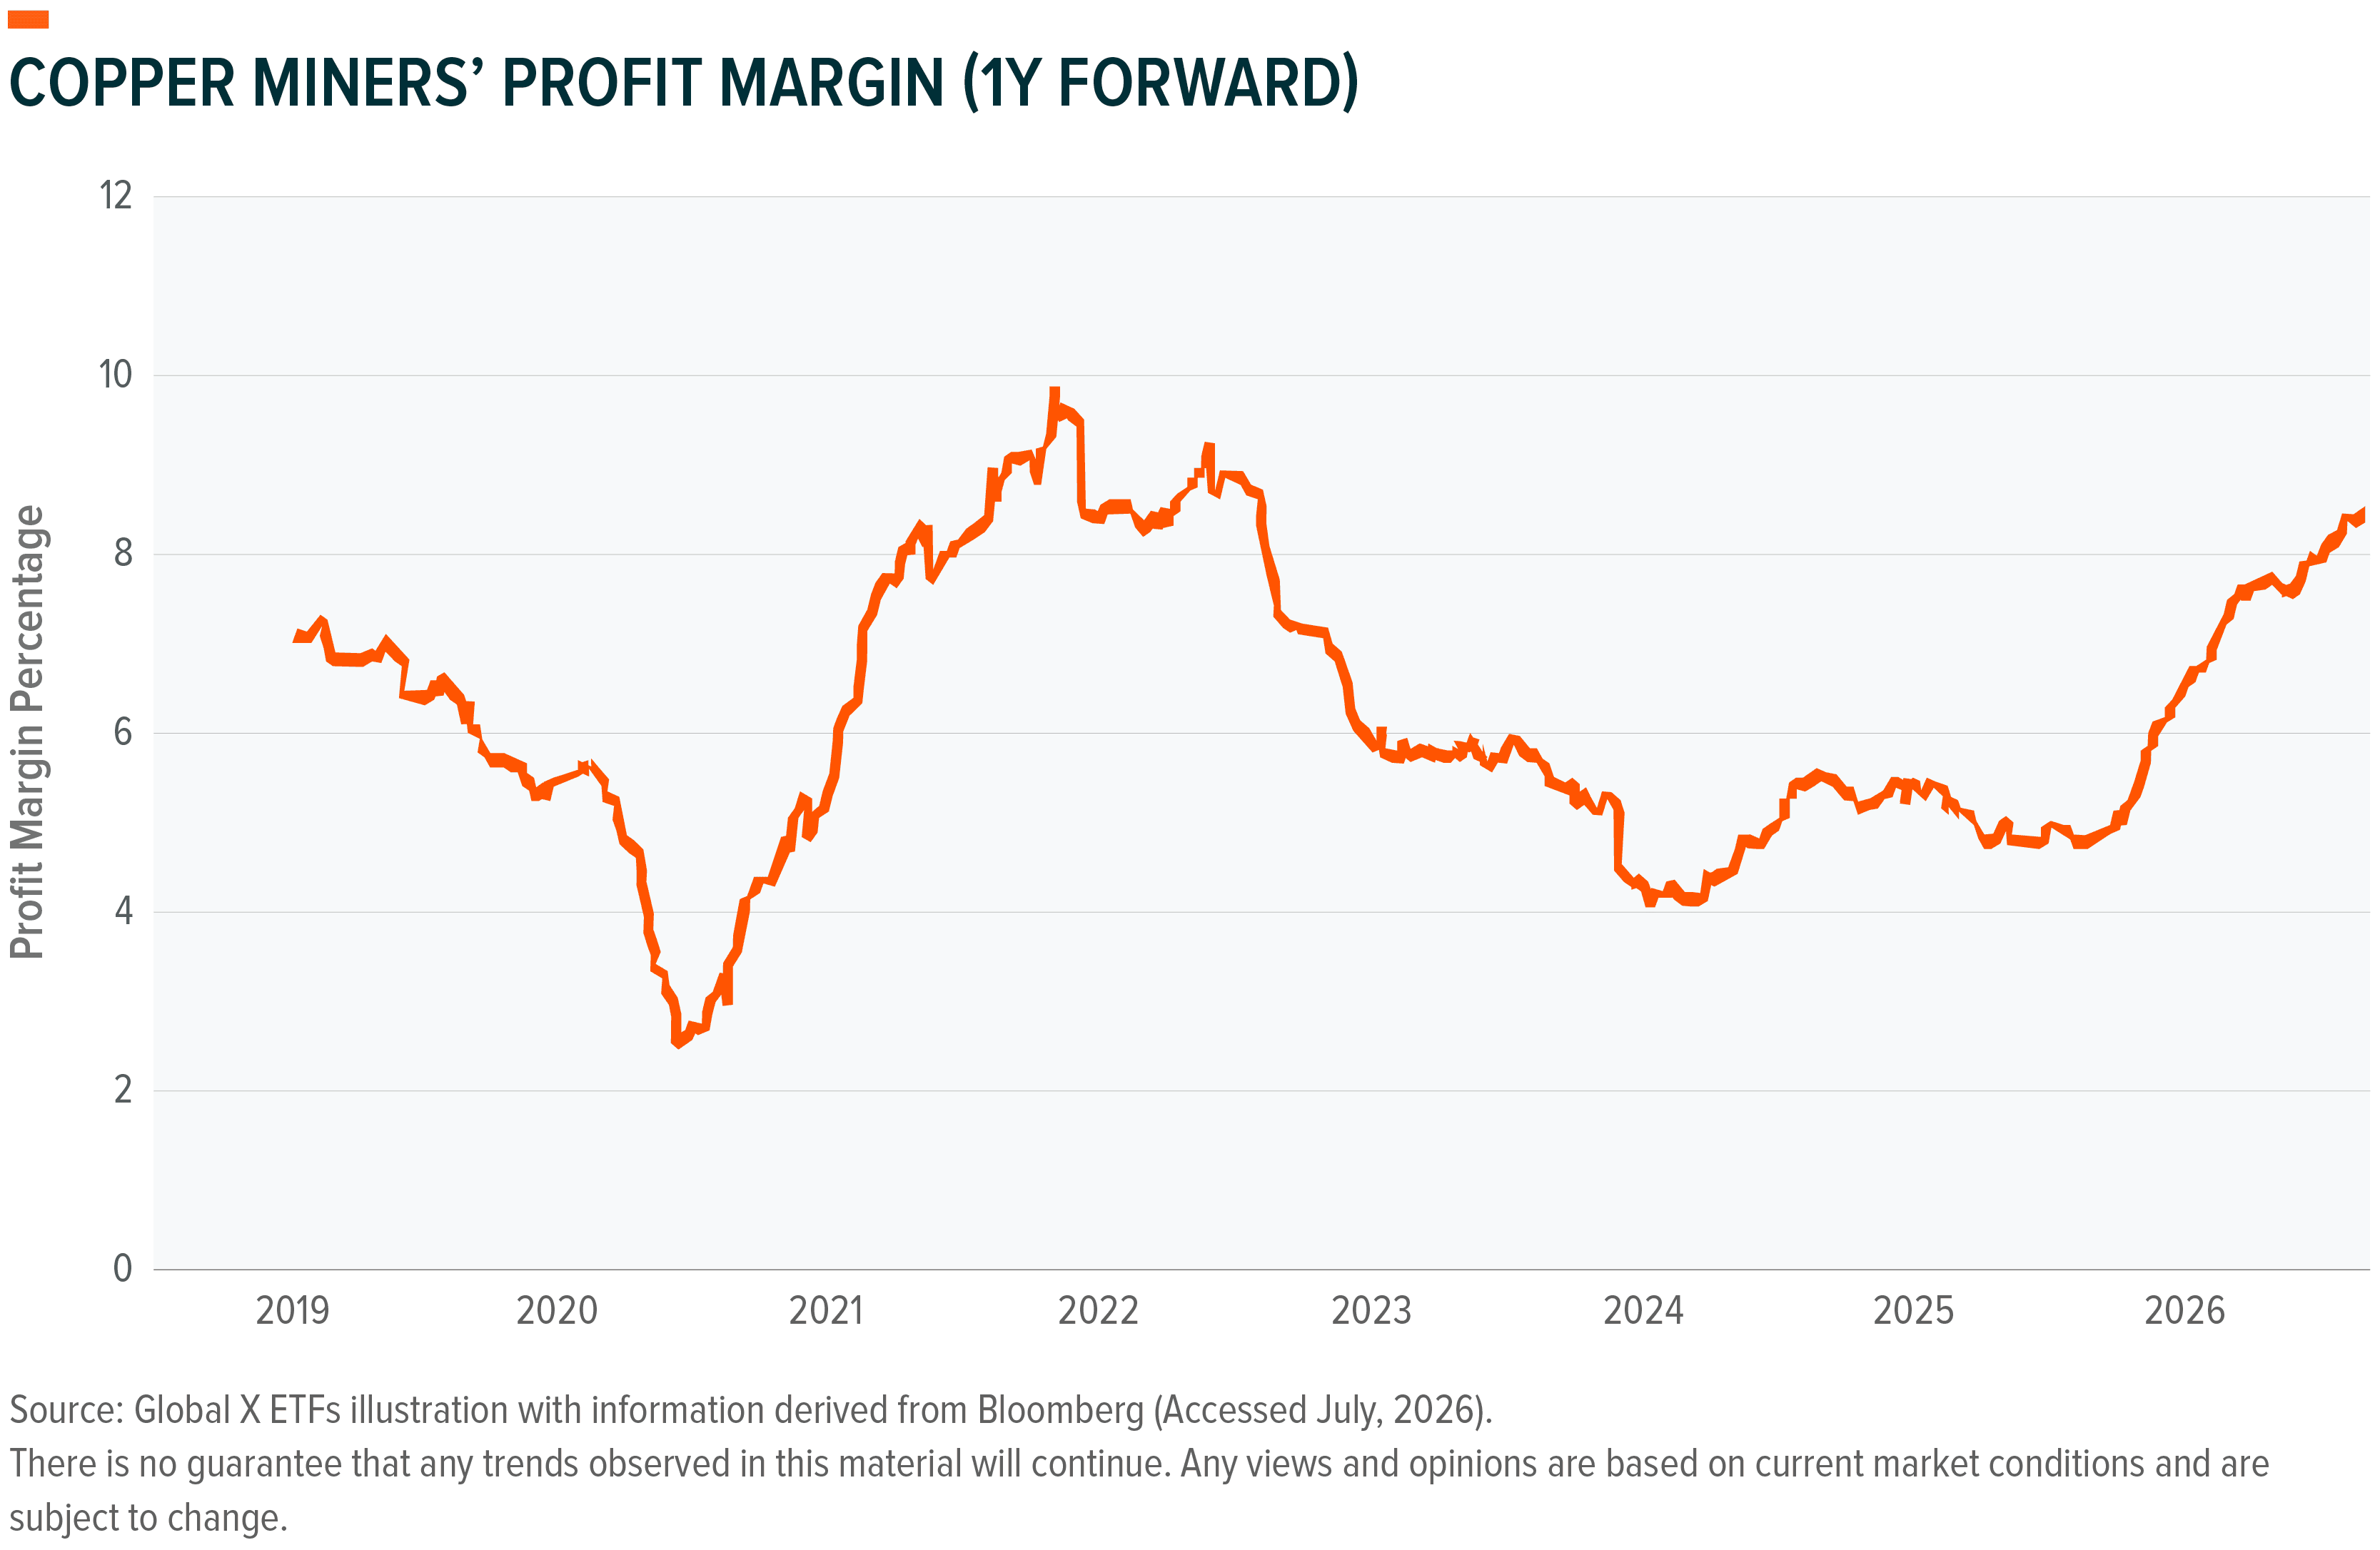
Historically, periods when rates work against the monetary assets are when opportunities open up. Silver miners now trade at a significant valuation discount to broad markets, whilst copper miners’ profit margins have continued to expand, demonstrating a strong ability to convert elevated copper prices into earnings.²⁷
Figure 7
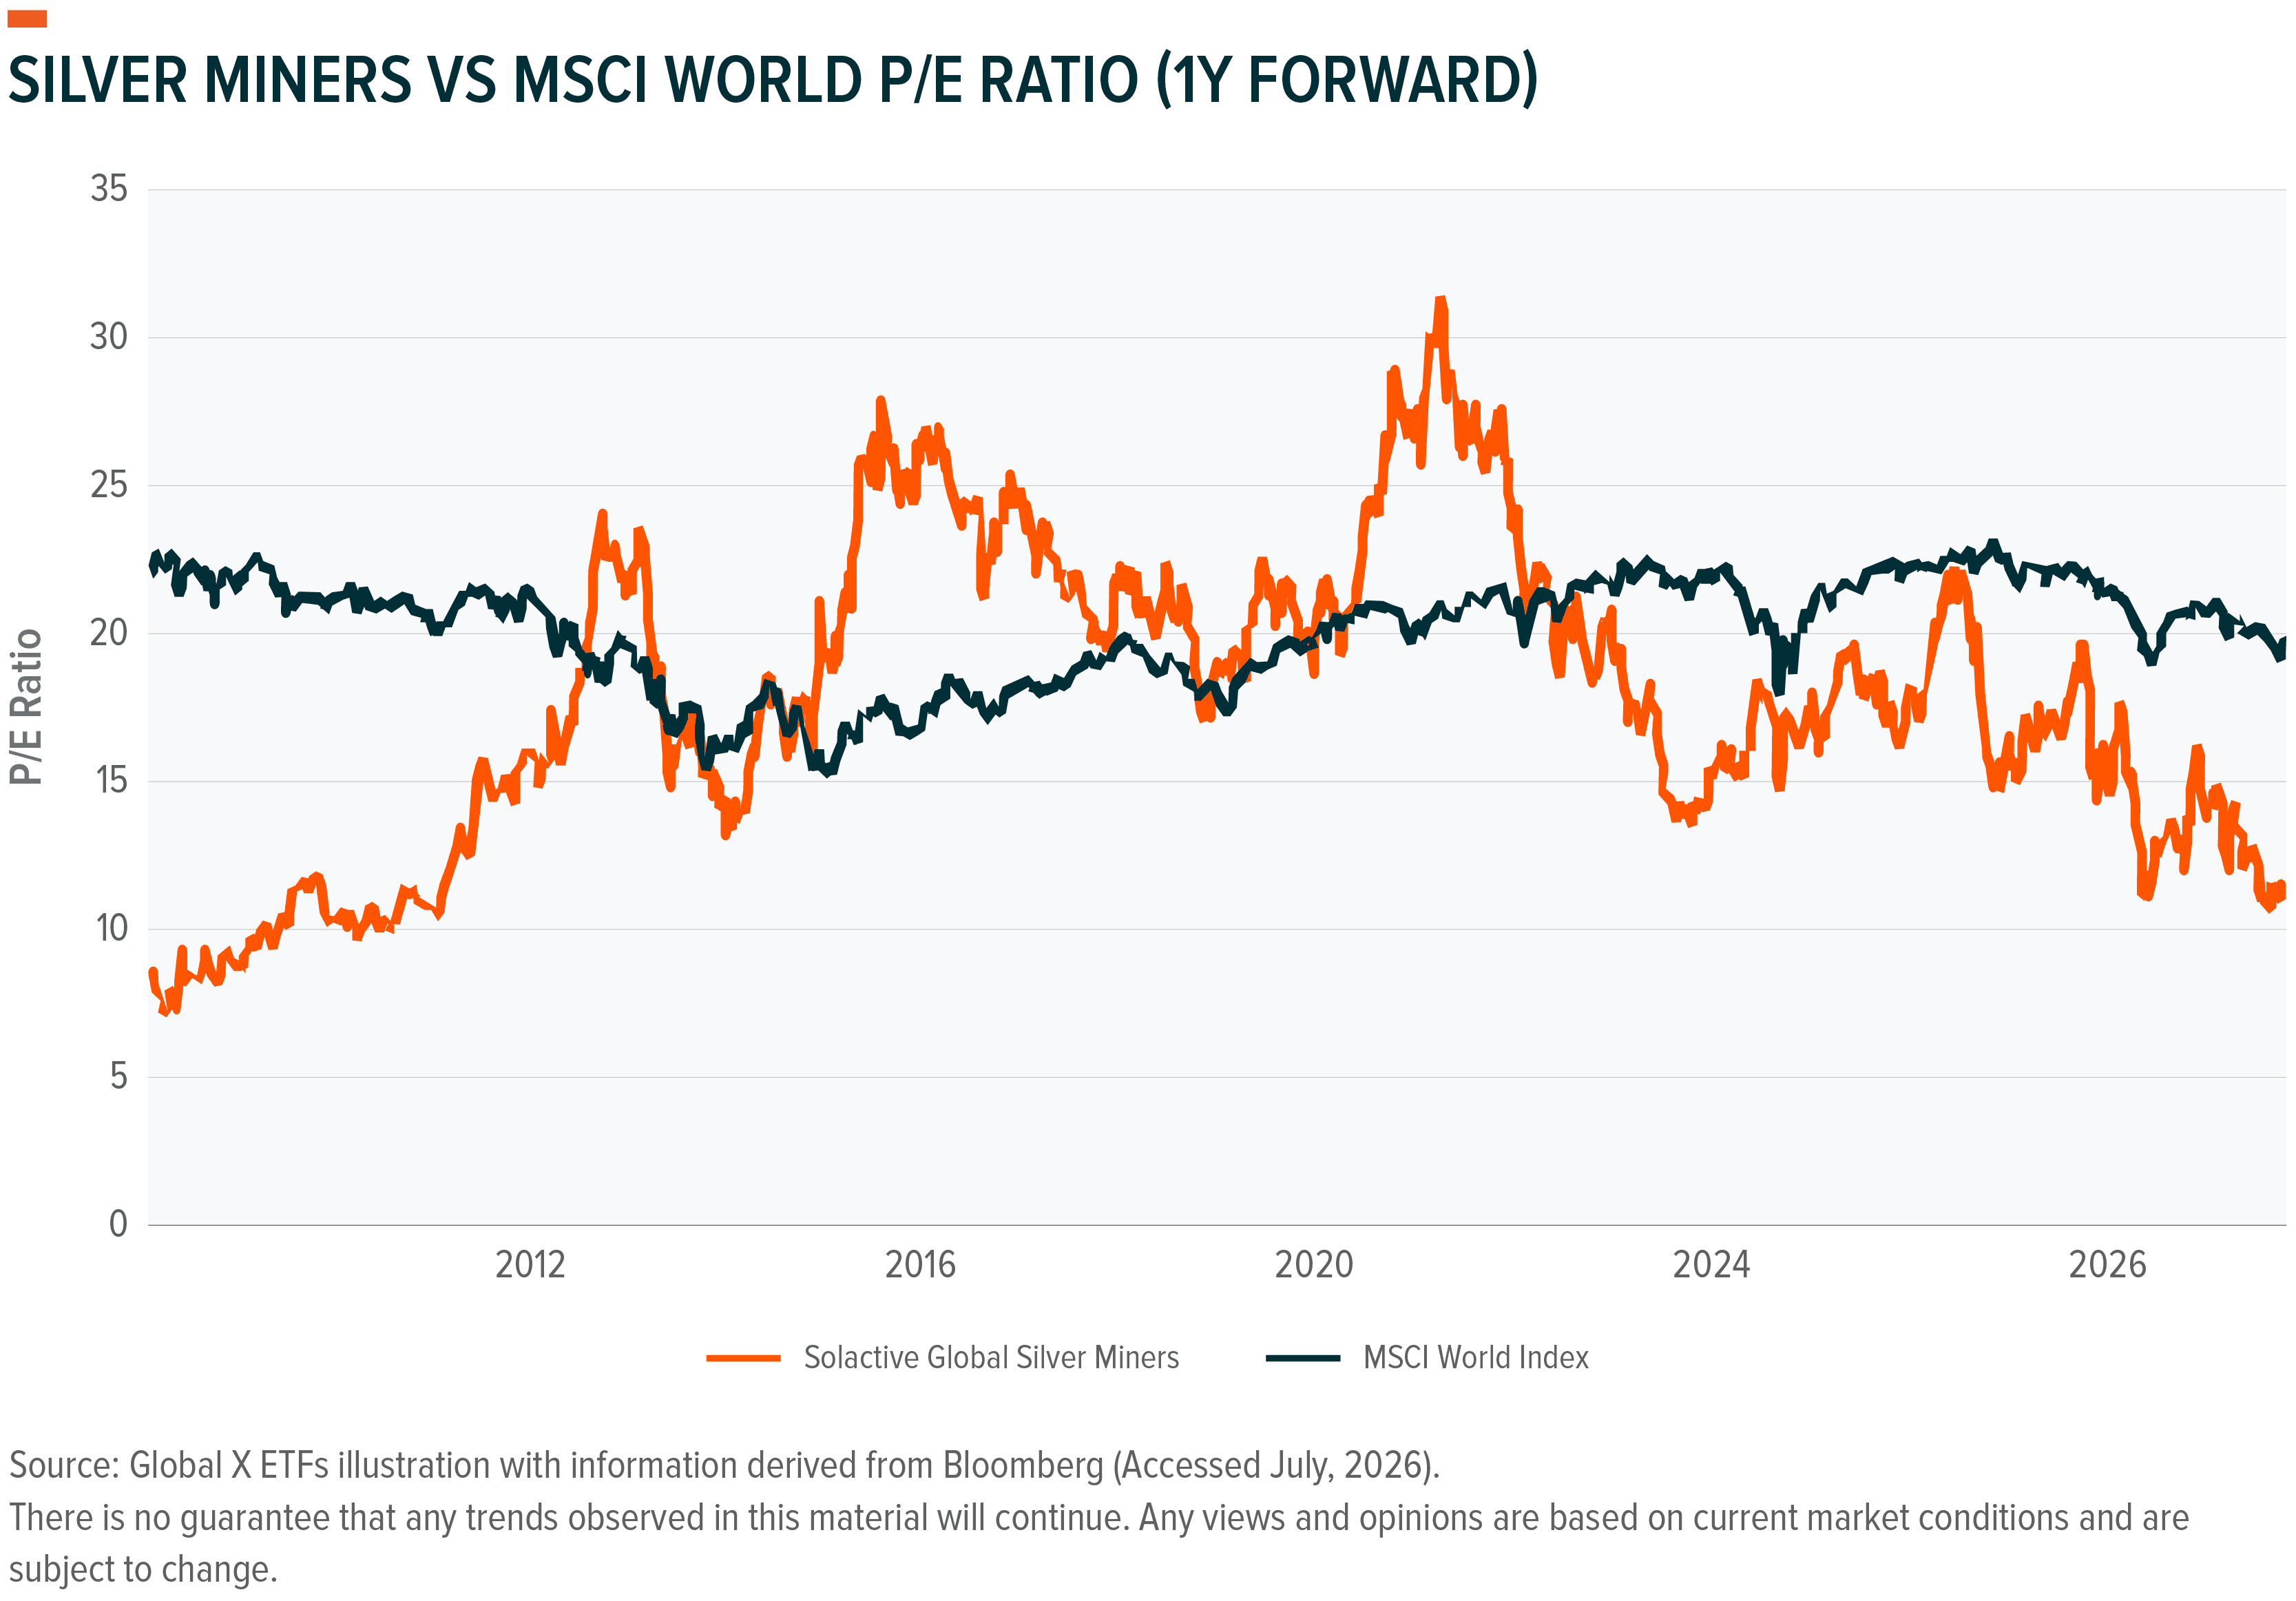
Figure 8
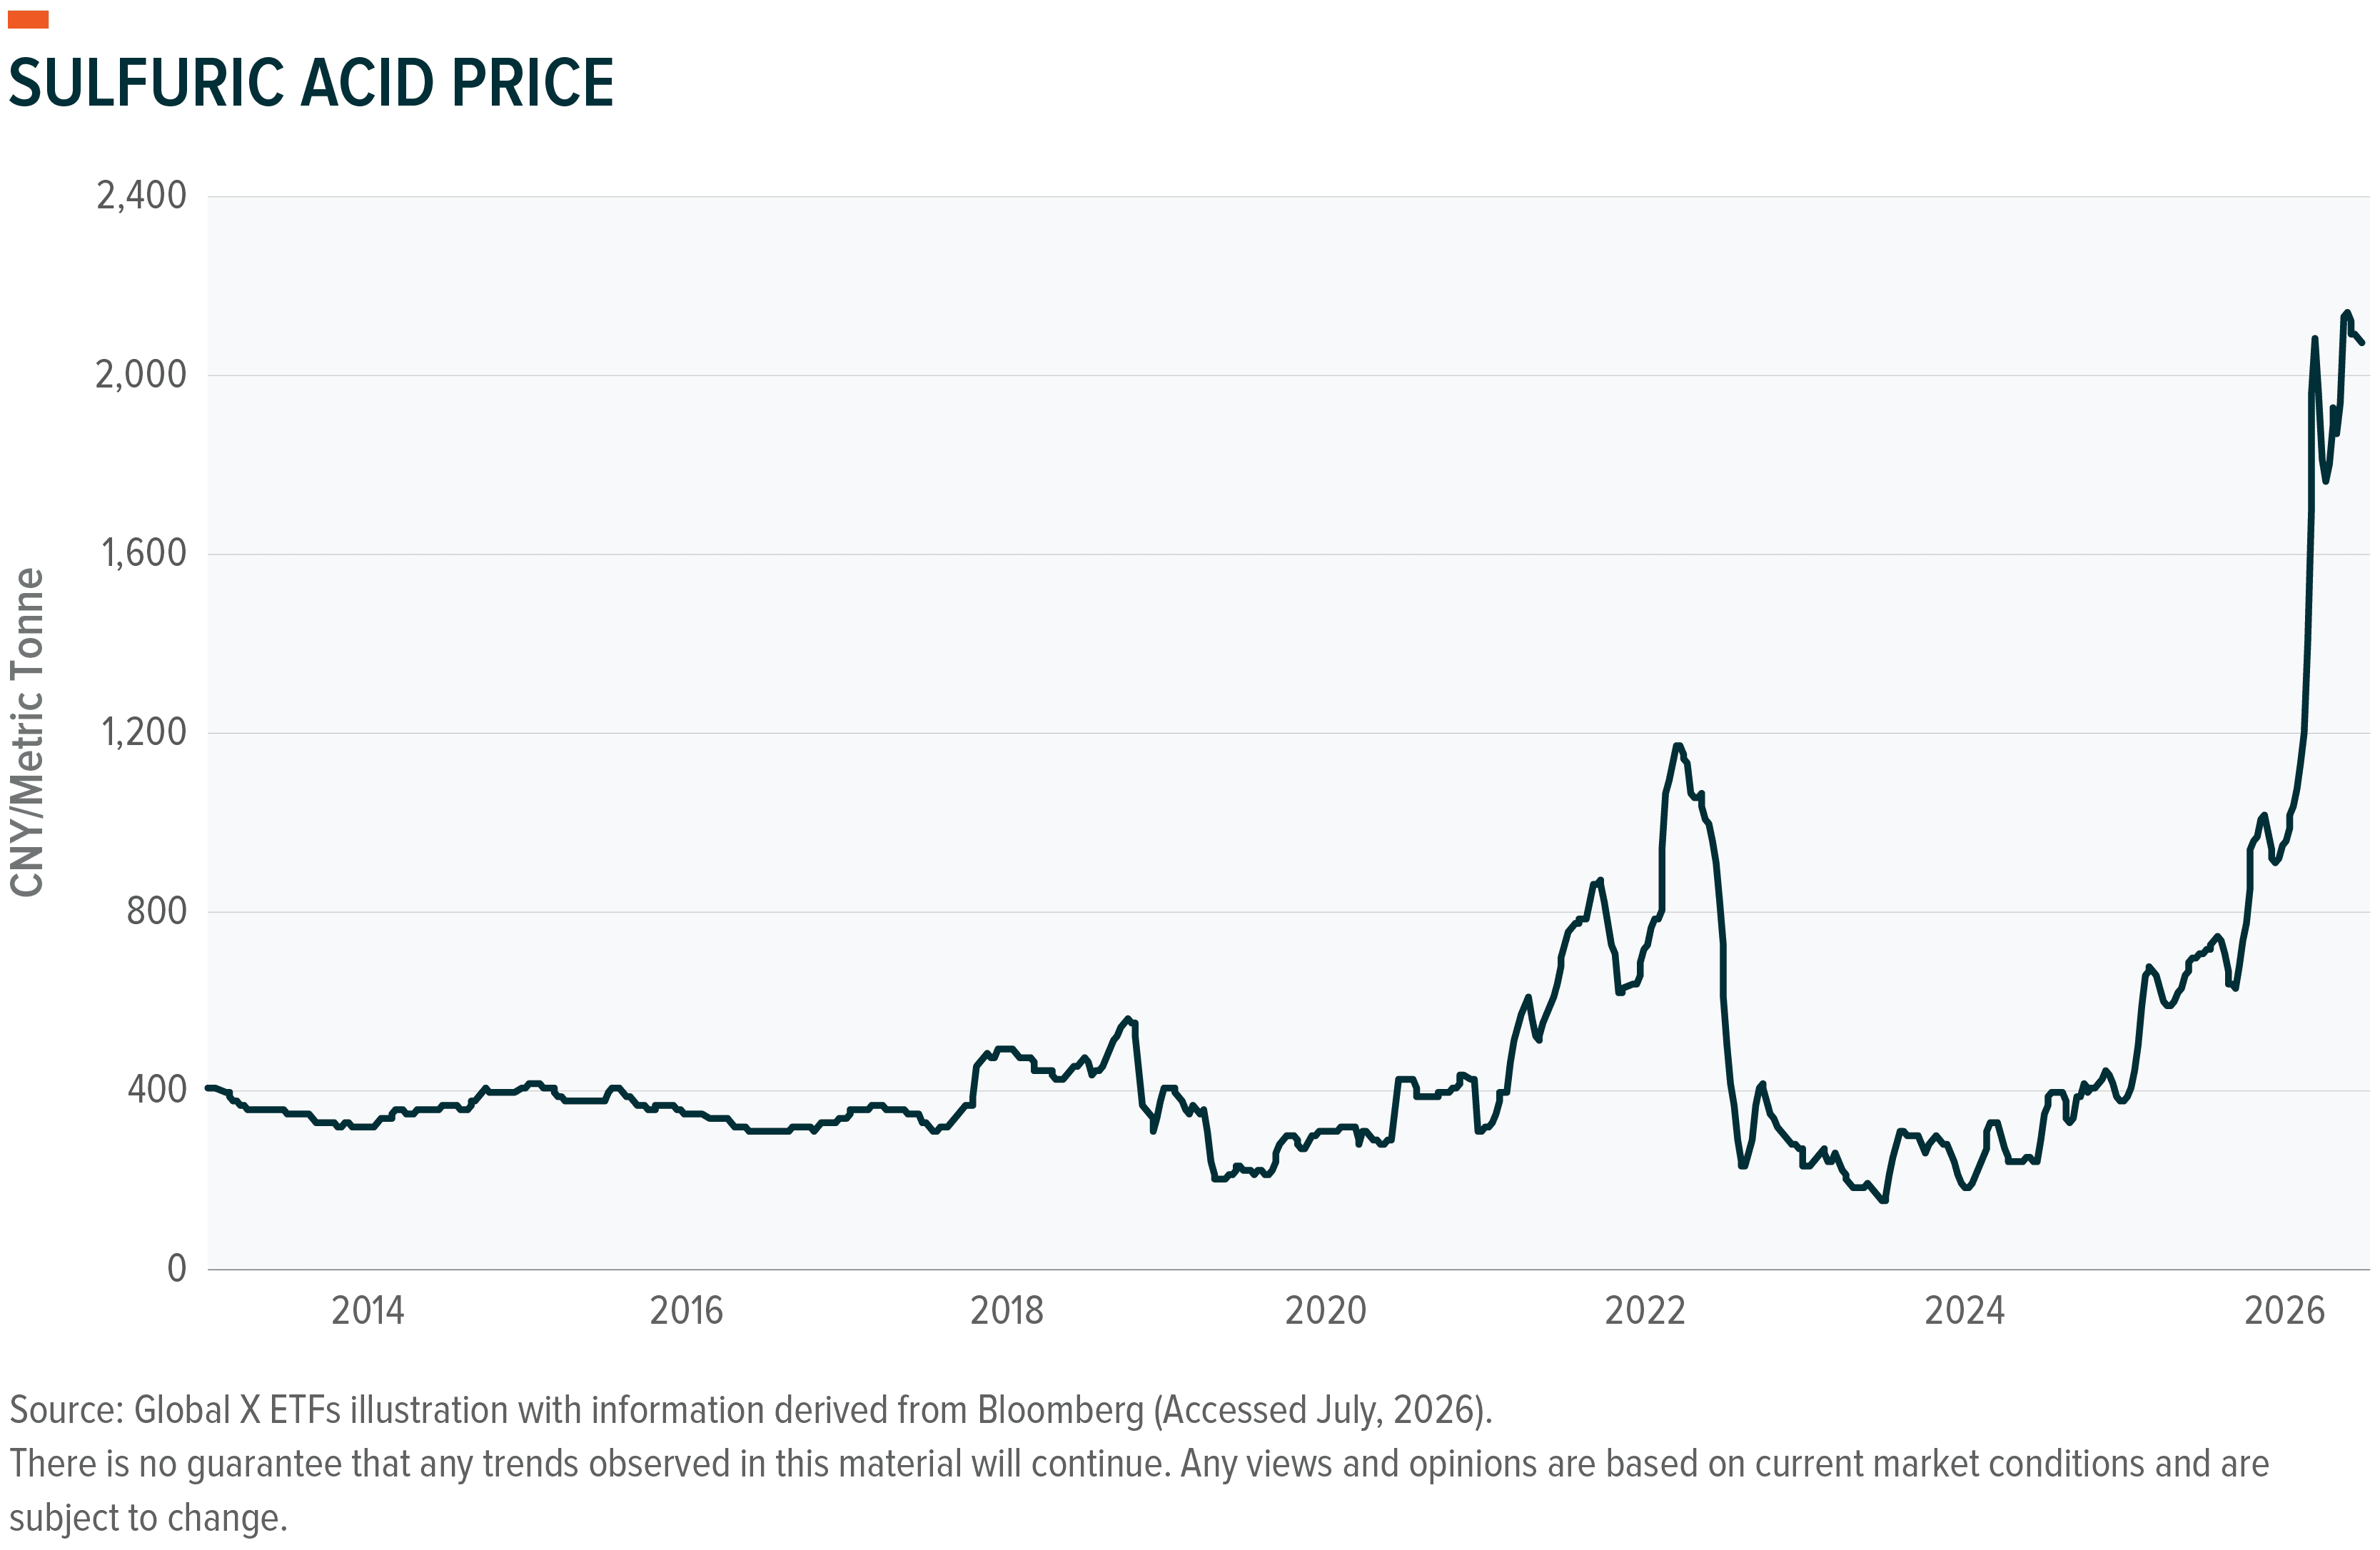
The Middle East conflict, El Niño-related weather risks and recent heatwaves have impacted prices of agricultural products as well as those of sulphuric acid, which is a critical input to fertiliser (and metals refining). Agricultural innovation, therefore, is taking on a growing role in food security as cost pressures and scarcity risks increase.²⁸ The World Bank expects fertiliser prices to rise by 31% in 2026, potentially increasing agricultural production costs and encouraging capital expenditure in productivity-enhancing technologies such as precision farming, automation, advanced seeds, irrigation and crop protection.²⁹
Figure 9
Options-Based Strategies
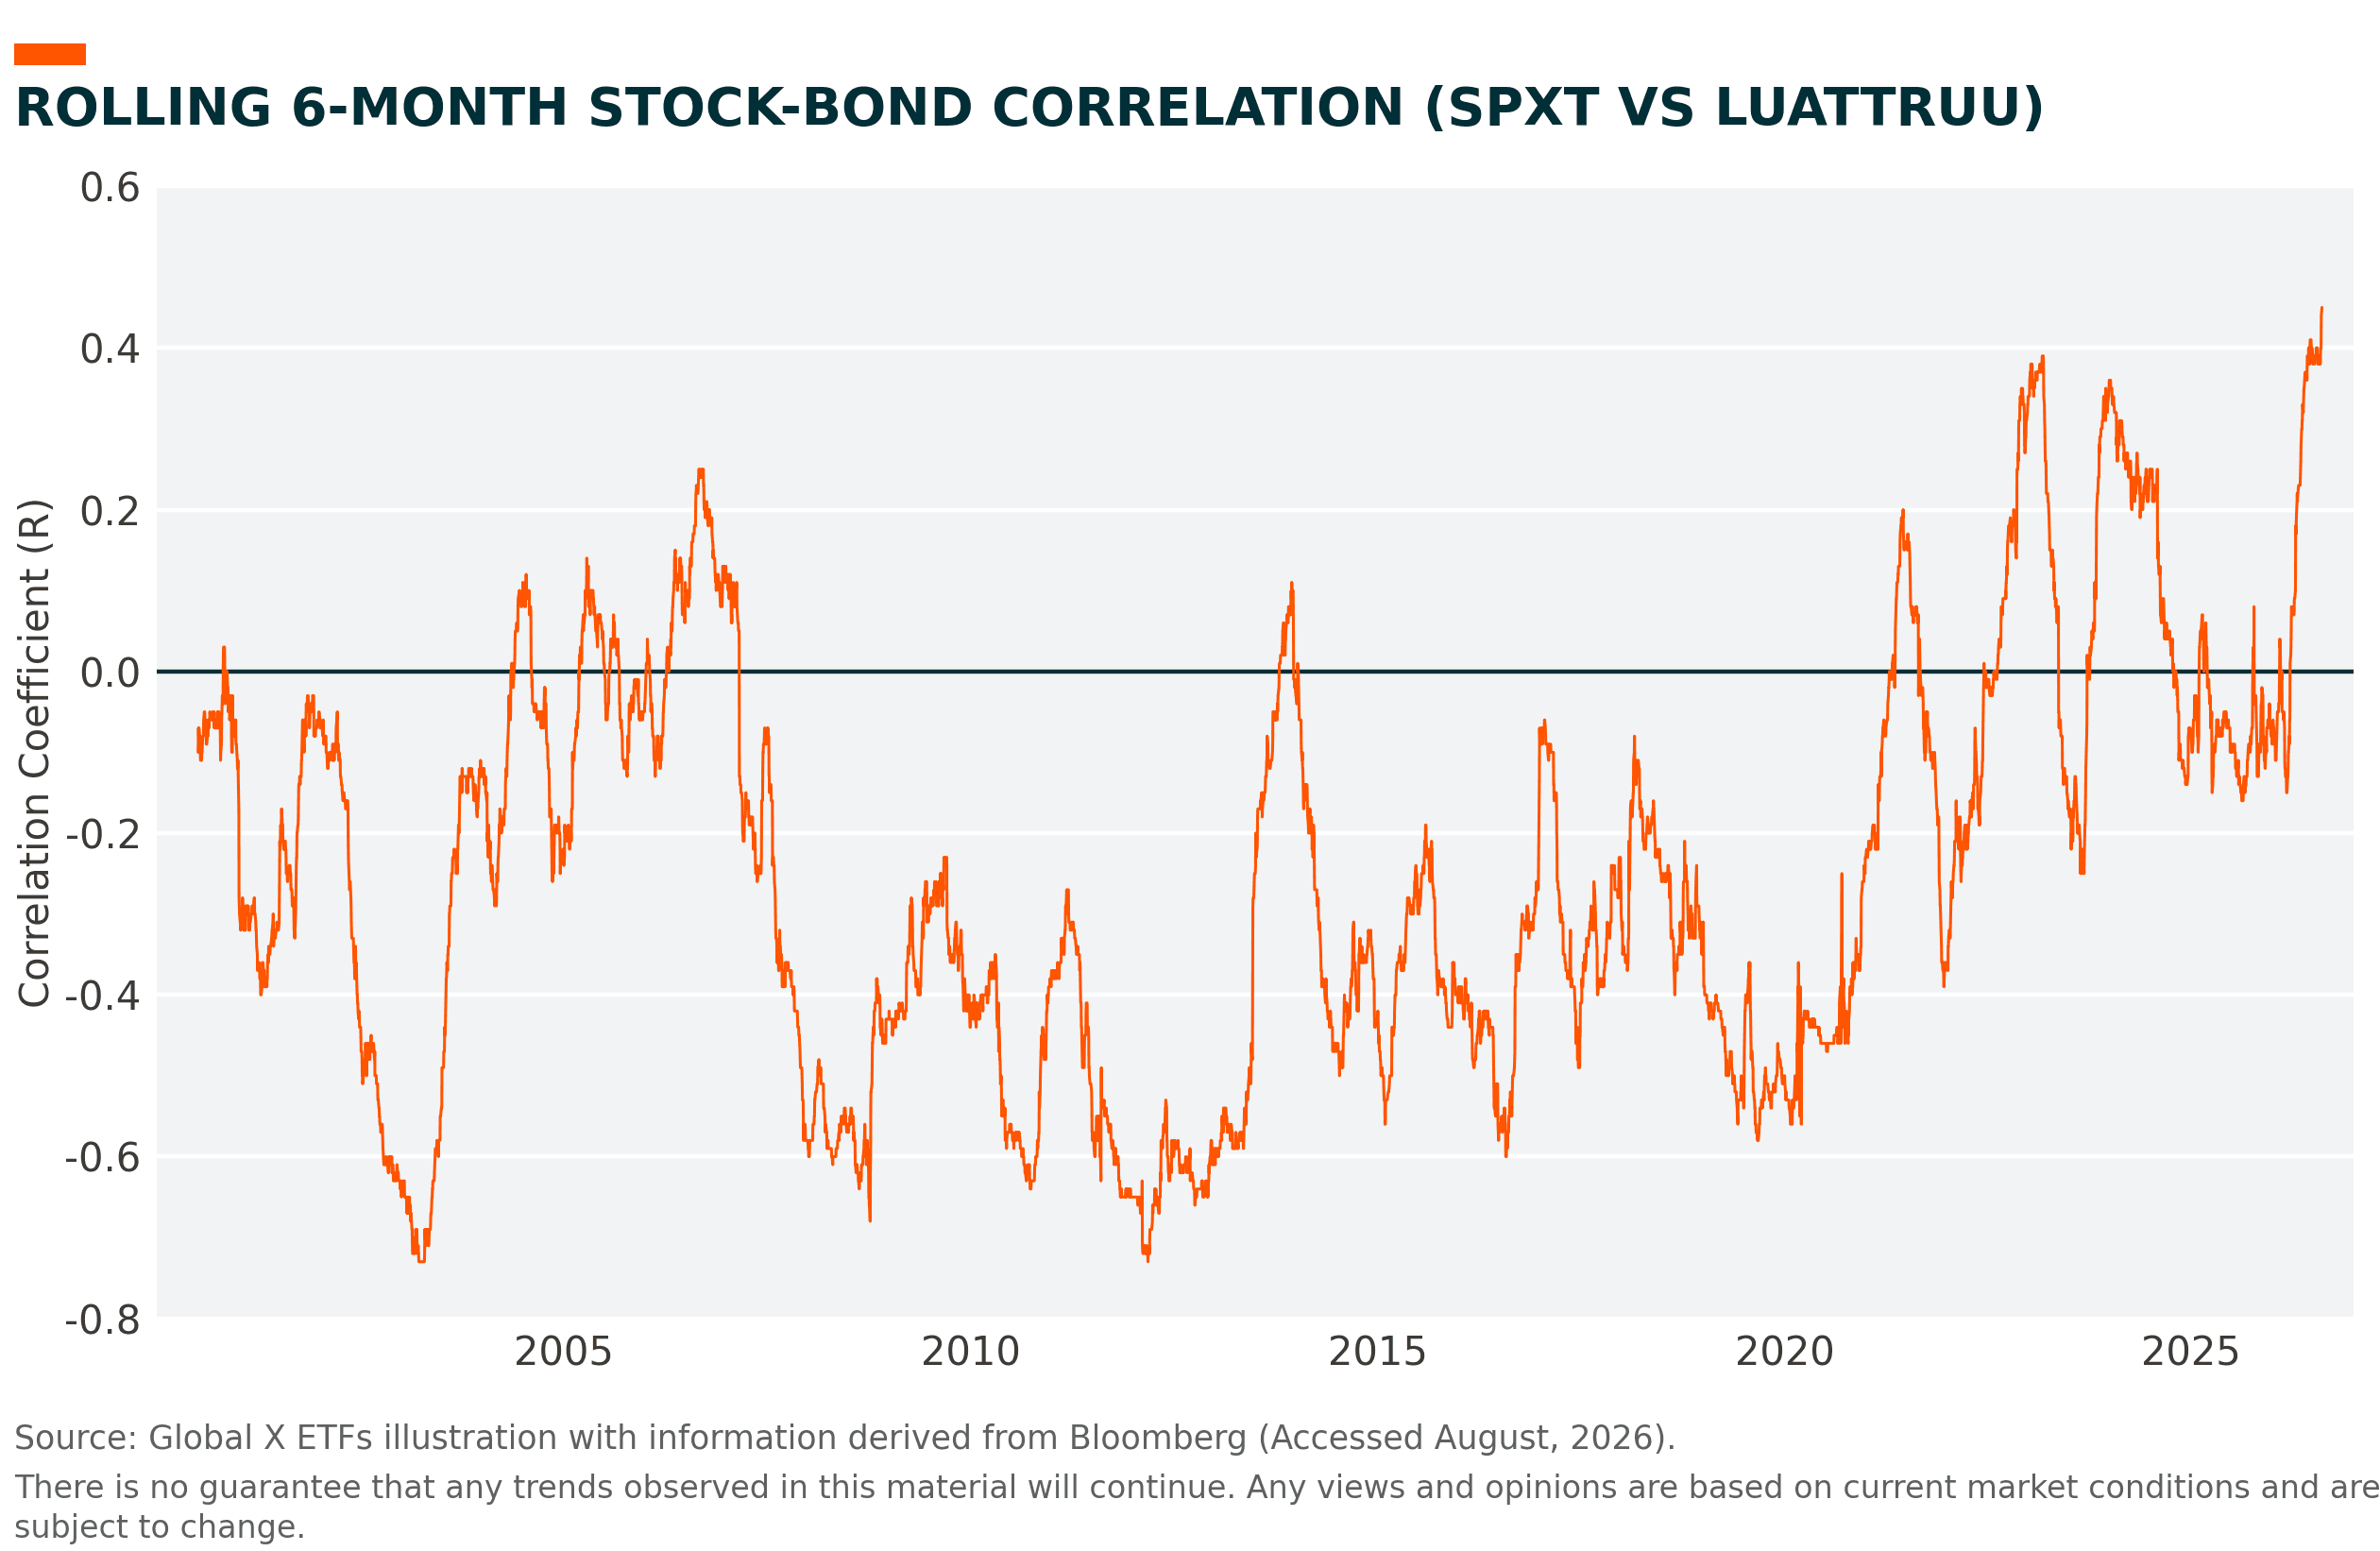
The structural case above coexists with material risk, which the first half reinforced.³⁰ Geopolitical shock demonstrated how ineffective duration has become at hedging equity risk, with correlations reaching extreme positive levels.³¹ This has left investors searching for a diversity of hedges that also allow for participation in rallies.³²
Options-based hedged products are built for these conditions. Covered call strategies benefit from elevated volatility by nature and convert a portion of upside into income while lowering the beta of an equity holding.³³ Buffer strategies place explicit limits on drawdowns over a defined period.³⁴ Neither requires a directional view, because they change the shape of an exposure rather than the exposure itself.
Figure 10
This document is not intended to be, or does not constitute, investment research as defined by the Financial Conduct Authority.
1 Global X ETFs analysis with data derived from Bloomberg LP (Accessed July 2026).
2 World Bank (April 2026) Commodity Markets Outlook: the Middle East conflict and Strait of Hormuz disruption drive projected 2026 increases of ~24% in energy and ~31% in fertiliser prices.
3 International Energy Agency (2026) Renewables 2025 / Electricity 2026: accelerating renewables deployment across developed and emerging markets.
4 Bloomberg Intelligence (2026) Copper Demand Is Set for Data-Center Boost: grid, transmission and distribution copper intensity materially exceeds the copper content of the data-centre facility itself.
5 AQR (2026) A Positive Stock-Bond Correlation Is a Terrible Reason to Add More Equity Risk.
6 Microsoft (October 2025) FY2026 First-Quarter Earnings Call: ~$80bn Azure order backlog unfulfillable owing to power and datacentre capacity constraints.
7 International Energy Agency (2026) Electricity 2026: over 2,500 GW of projects stalled in grid connection queues worldwide.
8 International Energy Agency (2026) Energy and AI: around 20% of planned data-centre projects at risk of delay absent action on grid bottlenecks.
9 S&P Global Market Intelligence / Regulatory Research Associates (April 2026) US Utility Capex Forecast: ~$1.3tn aggregate for US energy utilities, 2026–2030.
10 German Federal Ministry of Finance (2026) Special Fund for Infrastructure and Climate Neutrality (€500bn).
11 Indxx (2026) U.S. Infrastructure Development Index Methodology.
12 S&P Dow Jones Indices (2026) S&P Global Infrastructure Index Methodology.
13 Global X ETFs Analysis with Data derived from Bloomberg L.P. (Accessed July 2026).
14 Ibid.
15 Ibid.
16 Ibid.
17 International Energy Agency (2026) Electricity 2026 (System Flexibility): utility-scale battery storage as the principal lever for integrating intermittent renewable generation.
18 International Energy Agency (2026) Global EV Outlook 2026
19 Ibid.
20 Ibid.
21 International Energy Agency (2026) Electricity 2026 (System Flexibility): utility-scale battery storage as the principal lever for integrating intermittent renewable generation.
22 BloombergNEF (June 2027) Electric Vehicle Outlook, 2026.
23 Bloomberg L.P. (Data accessed July 2026).
24 Bloomberg L.P. (Data accessed July 2026).
25 The Silver Institute (2025) World Silver Survey 2025: industrial applications ~59% of total silver demand (2024).
26 Bloomberg L.P. (Data accessed July 2026).
27 Bloomberg L.P. (Data accessed July 2026).
28 World Bank (April 2026) Commodity Markets Outlook and FAO food-security analysis: rising input costs and yield risk raise the role of agricultural productivity technologies.
29 Ibid.
30 Bloomberg L.P. (Data accessed July 2026).
31 Bloomberg L.P. (Data accessed July 2026).
32 Goldman Sachs Asset Management (2026) Investment Outlook 2026: Shifting Paradigms for Portfolio Construction.
33 Bloomberg L.P. (Data accessed July 2026).
34 Cboe Global Markets (2026) Cboe S&P 500 Buffer Protect Index Series Methodology