Europe
The S&P 500 increased 10.6% in Q1, driven by strong earnings despite cooling growth and lower rates prospects.1 Better-than-expected manufacturing activity, a still-resilient job market, and continued capex momentum amid incentives from the Inflation Reduction Act (IRA) may be able to support U.S. equities.2 But in Q2, upside for the S&P 500 Index seems limited by the risks of resurgent inflation, possibly higher for longer rates, and financial stability concerns led by the commercial real estate sector.
The Q2 outlook for the U.S. equity benchmark appears to suggest staying cautiously invested amid likely heightened market volatility and several notable tail risks. Among the strategies that can perform in this type of environment, covered call and buffer strategies could be highlighted for their upside potential.
Investment Strategy Views on the S&P 500 Index for Q2 2024:
The likelihood of the Fed achieving a soft landing appears higher after the Institute for Supply Management (ISM) Manufacturing Purchasing Managers Index (PMI) returned to expansion territory in March for the first time since September 2022.3 Manufacturing was the only negative contributor to the February change in non-farm payrolls, and improved manufacturing employment has supported job gains in March.4 Meanwhile, personal spending was stronger than expected in February, providing support to employment in discretionary sectors such as hospitality, healthcare, and leisure.5 Another strong job report in March increased the risk of resurgent inflation, denting market sentiment by delaying expectations for the first rate cut to the second half.6 Based on the Fed funds futures, market participants now expect the first rate cut in September instead of June.7
Whether the need for fewer cuts signals upside for equities depends on the reasons for higher structural rates. If the reason is that the economy strengthens, S&P 500 earnings estimates for the remainder of the year and 2025 could get a boost. But if the reason is resurgent inflation while the economy weakens, pressure on earnings estimates for the coming quarters could be expected.
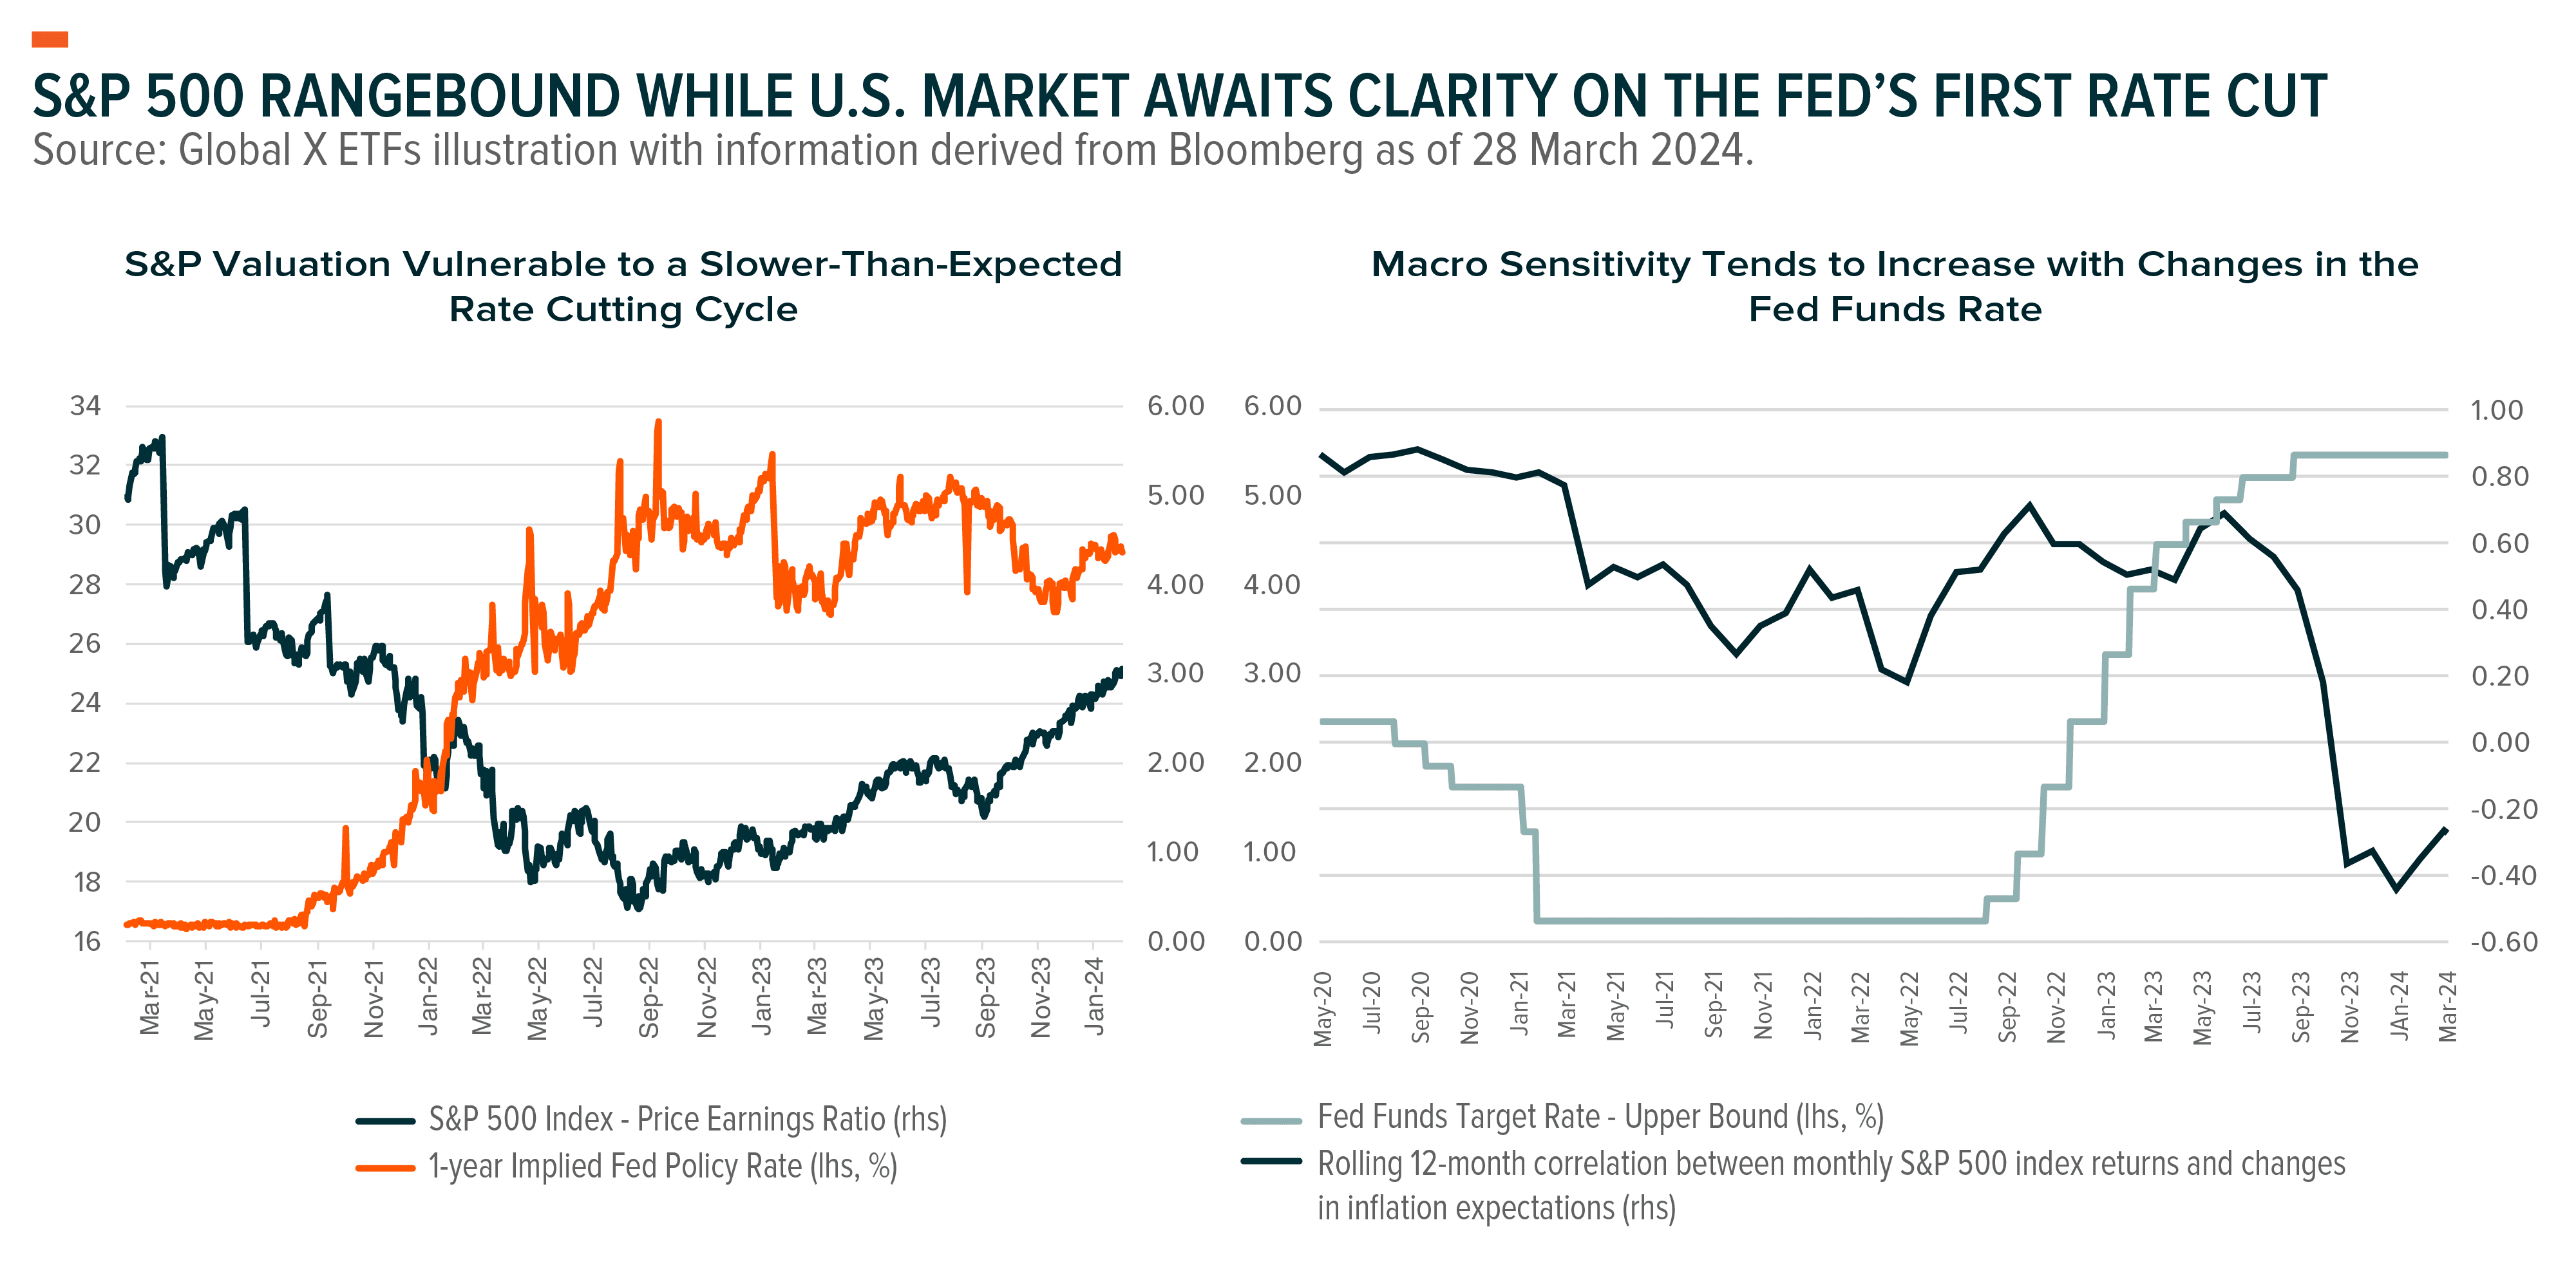
For Q1, the downward revision of 2.5% to estimated earnings from the start of the year and negative EPS guidance from companies weighed on the quarter’s estimated year-over-year earnings growth rate.8 Seven of the S&P’s 11 sectors are projected to report year-over-year earnings growth, led by Utilities, Information Technology, Communication Services, and Consumer Discretionary. The other four sectors are projected to report year-over-year declines, led by Energy and Materials. In terms of revenues, the S&P 500 is now expected to report revenue growth of 3.5% yoy for Q1, down from 4.4% yoy at the beginning of the year.9 Analysts expect an earnings growth rate of 10.9% yoy for 2024, down from 11.8% in January.10 Currently, the forward 12-month P/E ratio is 20.5, above its 5- and 10-year averages of 19.1 and 17.7, respectively, though it has trended lower since the beginning of Q2 amid solid economic data.11
Despite markets gradually revising their expectations for rate cuts from six to less than three currently, the S&P 500 index still gained over 10% in Q1.12 The second quarter started on a different note with the S&P 500 falling 0.92% in the first week of trading, led by Healthcare and Real Estate.8 Volatility ratcheted up quickly, with the VIX Index jumping 4 points to over 16 as of 8 April.13 Increased data dependency on the Fed outlook combined with high expectations for the upcoming earnings season is likely to translate into higher volatility in Q2 given the high macro sensitivity of U.S. stocks. Elevated S&P 500 multiples are vulnerable to changes in earnings forecasts should Q2 results disappoint and if the Fed delivers fewer rate cuts than the 63 basis points that the market is currently pricing in.14
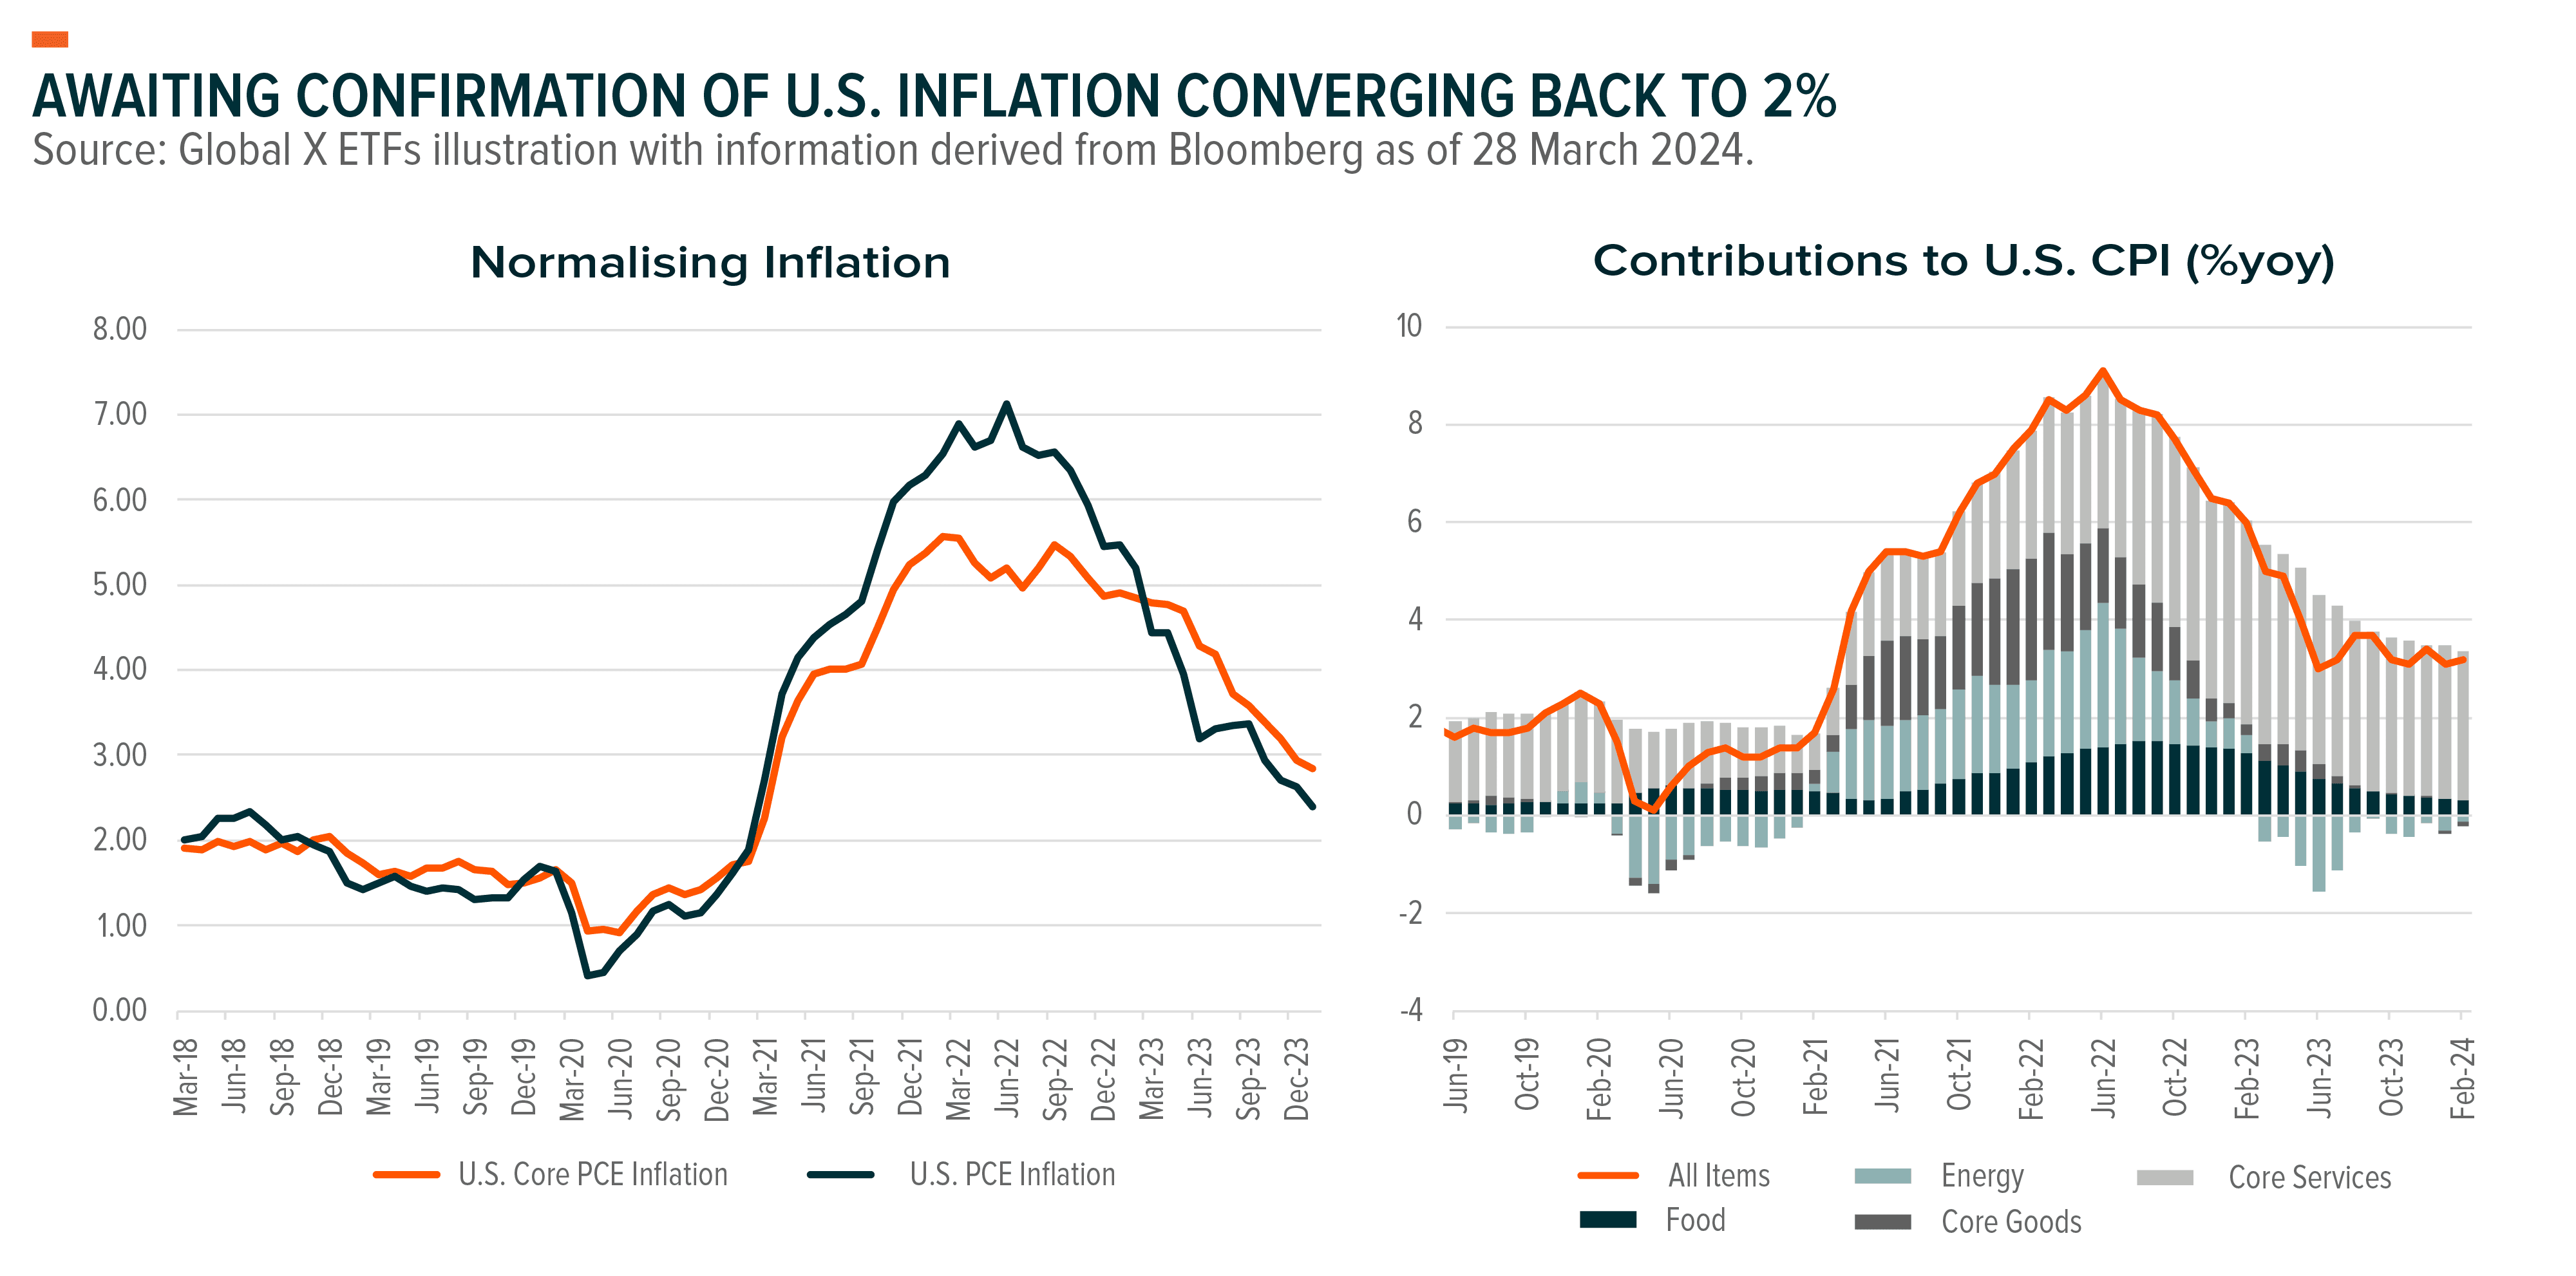
U.S. inflation figures for February surprised to the upside. Prices continued to increase at an above-target rate (3.2% yoy), led by core services (3.8% yoy).15 This overshoot seems to confirm that inflation remains a barrier to an immediate rate cut and the Fed’s 2% target remains a ways away. The strength of the U.S. dollar versus other major currencies helps keep imported inflation low. However, more than ever, U.S. inflation hinges on domestic factors, with transportation and housing inflation being major concerns for the Fed, along with food inflation’s impact on household balance sheets.16 Current risks for investors are skewed towards the market’s expectations for the Fed’s first cut moving beyond June.
Adding to market volatility is the recent rally in commodities, which spurred speculation that major central banks will keep interest rates higher for longer.17 The oil outlook will be a key input in inflation forecasts in Q2. It is expected that oil prices will likely remain in the $80–90 range, with upside potential to $95 Brent in the run-up to the next OPEC+ meeting in June. Russia limiting oil production is the primary driver on the supply side, while the tensions in the Middle East could be adding a risk premium. Also, consumer demand for fuel in Europe and China exceeded expectations in Q2 while manufacturing activity picked up in the U.S. and China.17
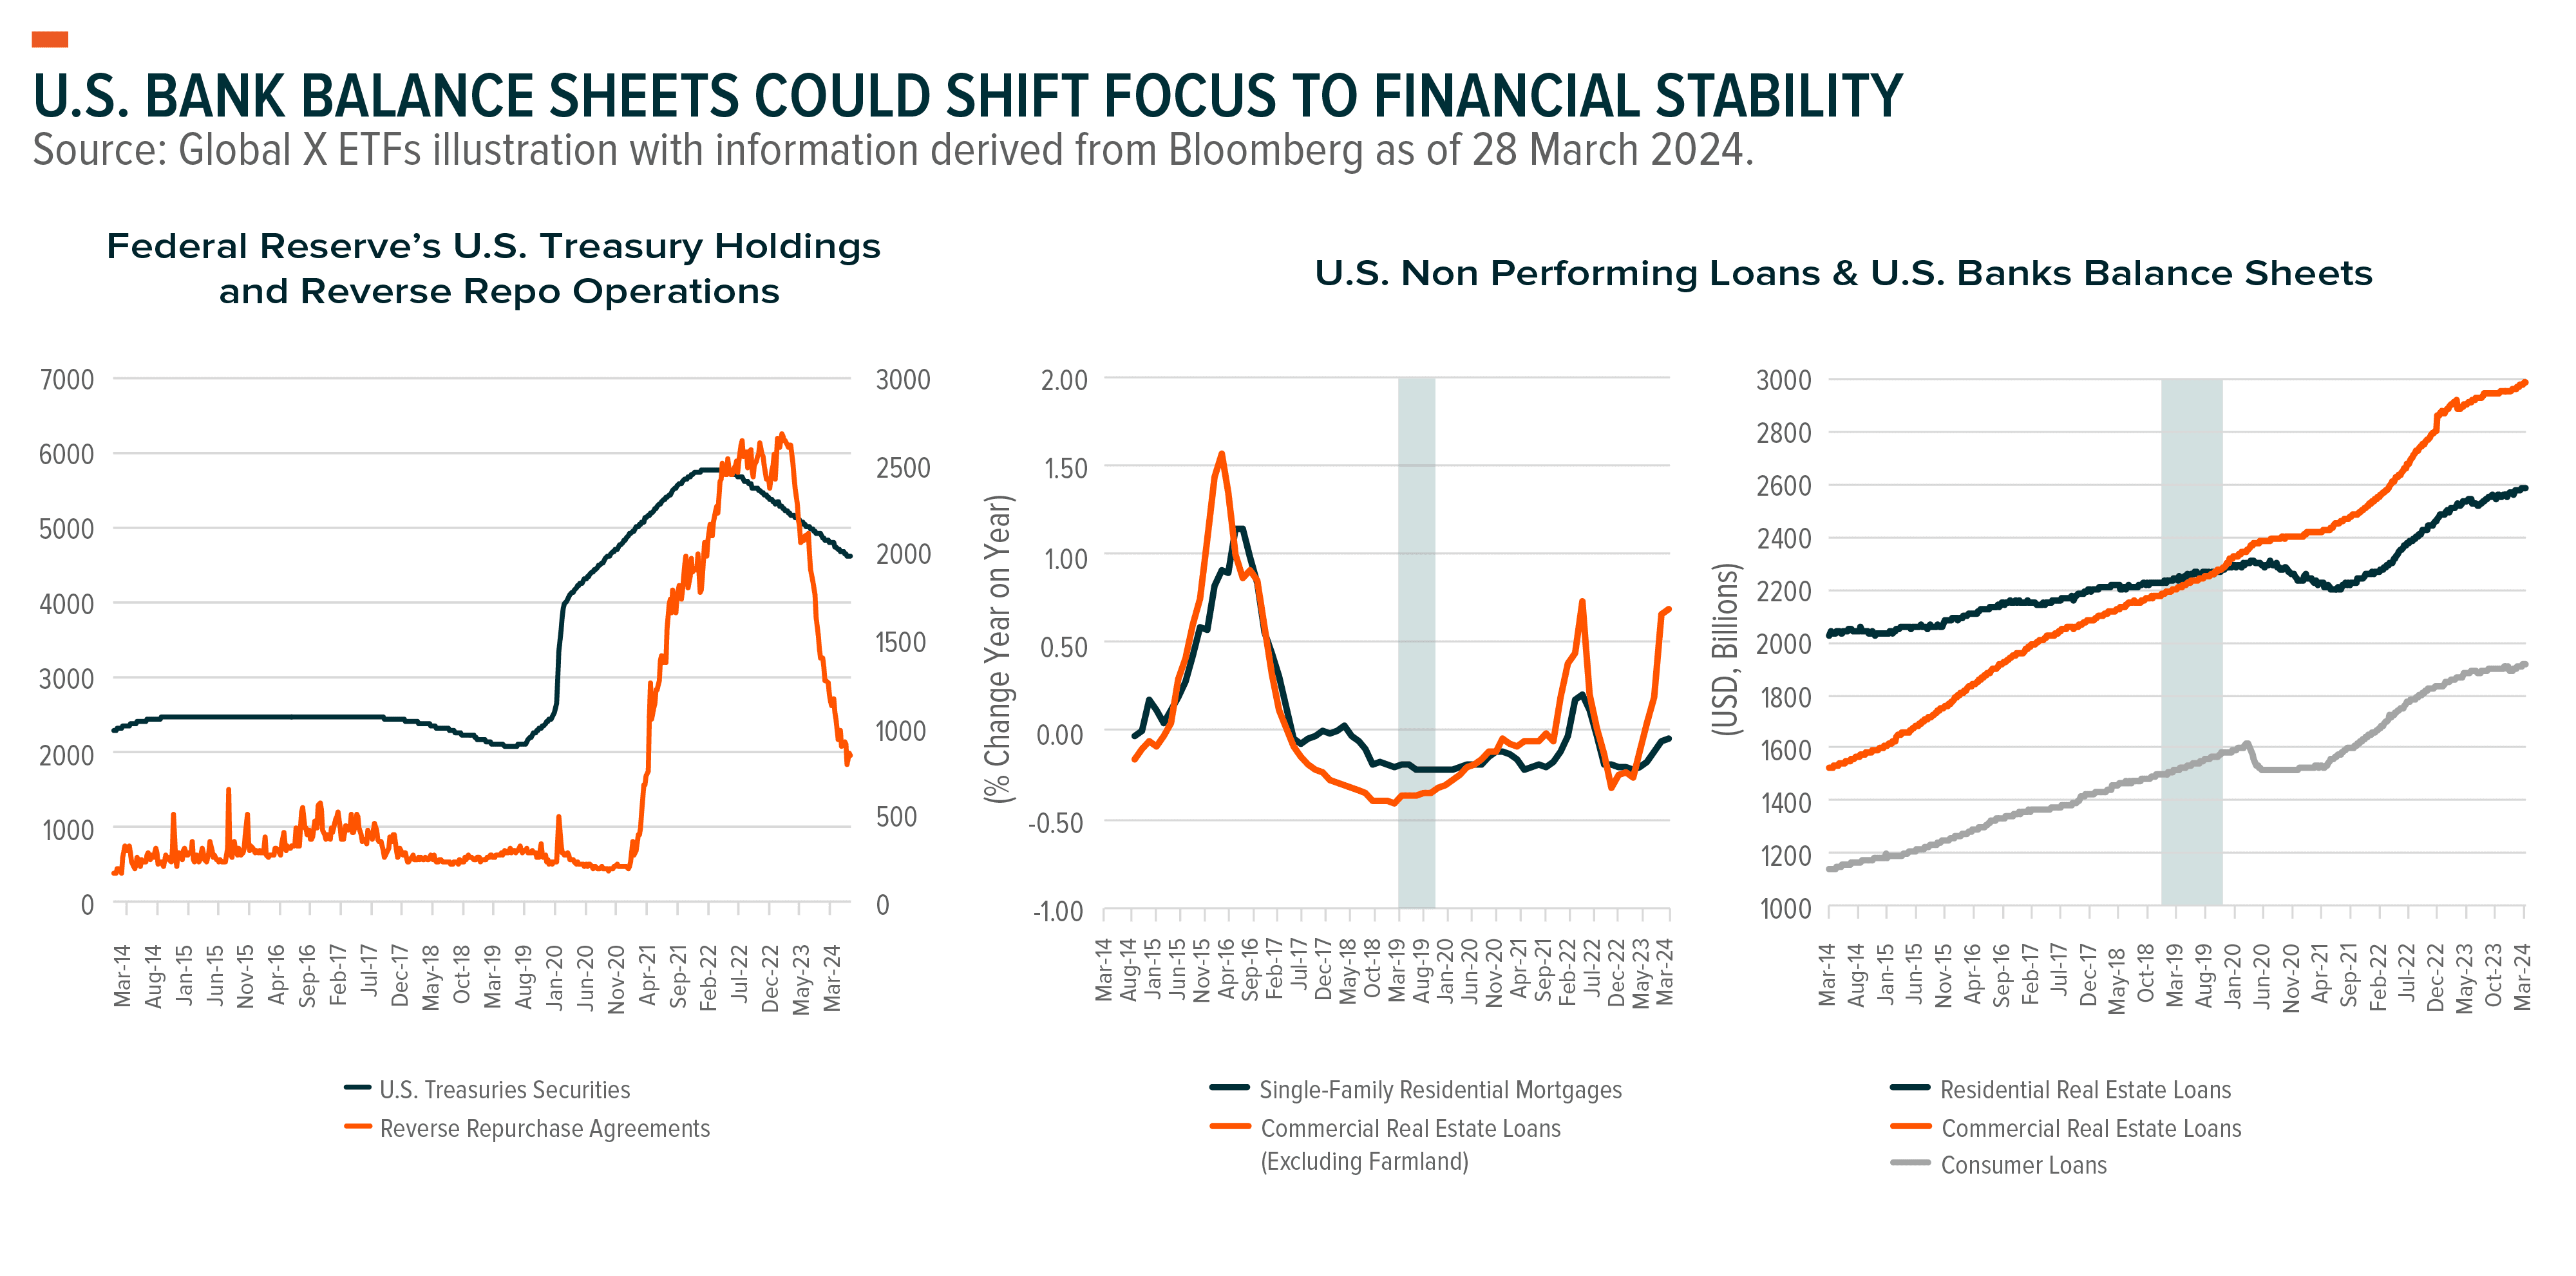
Challenges in the U.S. banking sector combined with a deterioration of the U.S. fiscal outlook and the Fed drying out its reverse repo facility could increase rate volatility and risk premiums on U.S. Treasuries across the curve. Risks to housing markets seem to be growing because of elevated mortgage rates and tightening lending standards, with many more potential borrowers left out of the market. Commercial real estate loan valuations could adjust sharply, raising concerns about financial risks and spillovers into banks and the broader economy. Concerns about financial institutions’ stability could lead to higher market volatility in the near term.
Combined, these concerns could force the Fed to start discussing adjustments to its balance sheet reductions as soon as its May meeting in an effort to ensure sufficient liquidity as financial institutions abandon reverse repo. The Fed is expected to increase its reinvestment into Treasuries by lowering the reinvestment cap from $60 billion to $30 billion. While the Fed intends to normalise its balance sheet, the debate between Federal Open Market Committee (FOMC) members might be about what level should be considered normal.
The Fed expects the normalisation to be complete when its balance sheet reaches a minimum level of ample reserves.18 According to the Fed’s estimate, bank reserves equal to 10–12% of nominal GDP, or $2.7–3.4 trillion at the year-end 2023 GDP level, would be ample.19 At the end of March, bank reserves were at the upper band with $3.4 trillion, though they are expected to drop to $3.2 trillion by Q1 2025 according to the median response in a January 2024 survey of primary dealers.20 The Fed is likely to buffer its estimate of the critical level of reserves above the 2019 level to avoid the risks of a surge in the overnight market rate, which happened in 2019 and forced the central bank to intervene.
This document is not intended to be, or does not constitute, investment research as defined by the Financial Conduct Authority.
1. Bloomberg as of 28 March 2024.
2. Publication 4450 (Rev. 2-2024) (irs.gov)
3. Institute for Supply Management, ISM Manufacturing PMI for March 2024.
4. Bureau of Labor Statistics, March 2024.
5. Bureau of Economic Analysis, February 2024.
6. Bloomberg as of 28 March 2024.
7. Microsoft Word - Earnings_Insight_040524.docx (factset.com)
8. Ibid.
9. Ibid.
10. Bloomberg as of 28 March 2024.
11. Ibid.
12. Ibid.
13. Ibid.
14. Bureau of Labor Statistics, February 2024.
15. Transcript of Chair Powell's Press Conference -- March 20, 2024 (federalreserve.gov)
16. Bloomberg as of 28 March 2024.
17. Ibid.
18. Transcript of Chair Powell's Press Conference -- December 13, 2023 (federalreserve.gov)
19. The Mechanics of Fed Balance Sheet Normalization | St. Louis Fed (stlouisfed.org)
20. jan-2024-spd-results.pdf (newyorkfed.org)