Europe
Marketing Communication. Capital at risk. For Professional Investors Only.
Institutional allocators in 2026 are dealing with a familiar problem, but it has become more acute. Equity valuations remain elevated, fixed income has not consistently delivered diversification in periods of stress, and geopolitical risk is driving sharp moves that are hard to time. Defined Outcome strategies offer a pre-defined downside buffer and a capped level of upside participation over a set period. In practice, this means portfolios can stay invested through volatility, absorbing part of any drawdown rather than trying to sidestep it altogether.
This paper explores why defined outcome strategies matter and how to implement them. Our visual guide Defining Outcome: A Smarter Way to Stay Invested breaks down the mechanics step by step.
For the better part of four decades, the 60/40 portfolio rested on a single structural assumption in that that bonds and equities move in opposite directions when it matters most. That assumption was tested severely in 2022, when both the S&P 500 and US long duration Treasuries registered double digit negative annual returns in the same calendar year, the first time that had occurred since reliable data began in 1928.³,⁴ That correlation breakdown has not fully corrected in recent years.
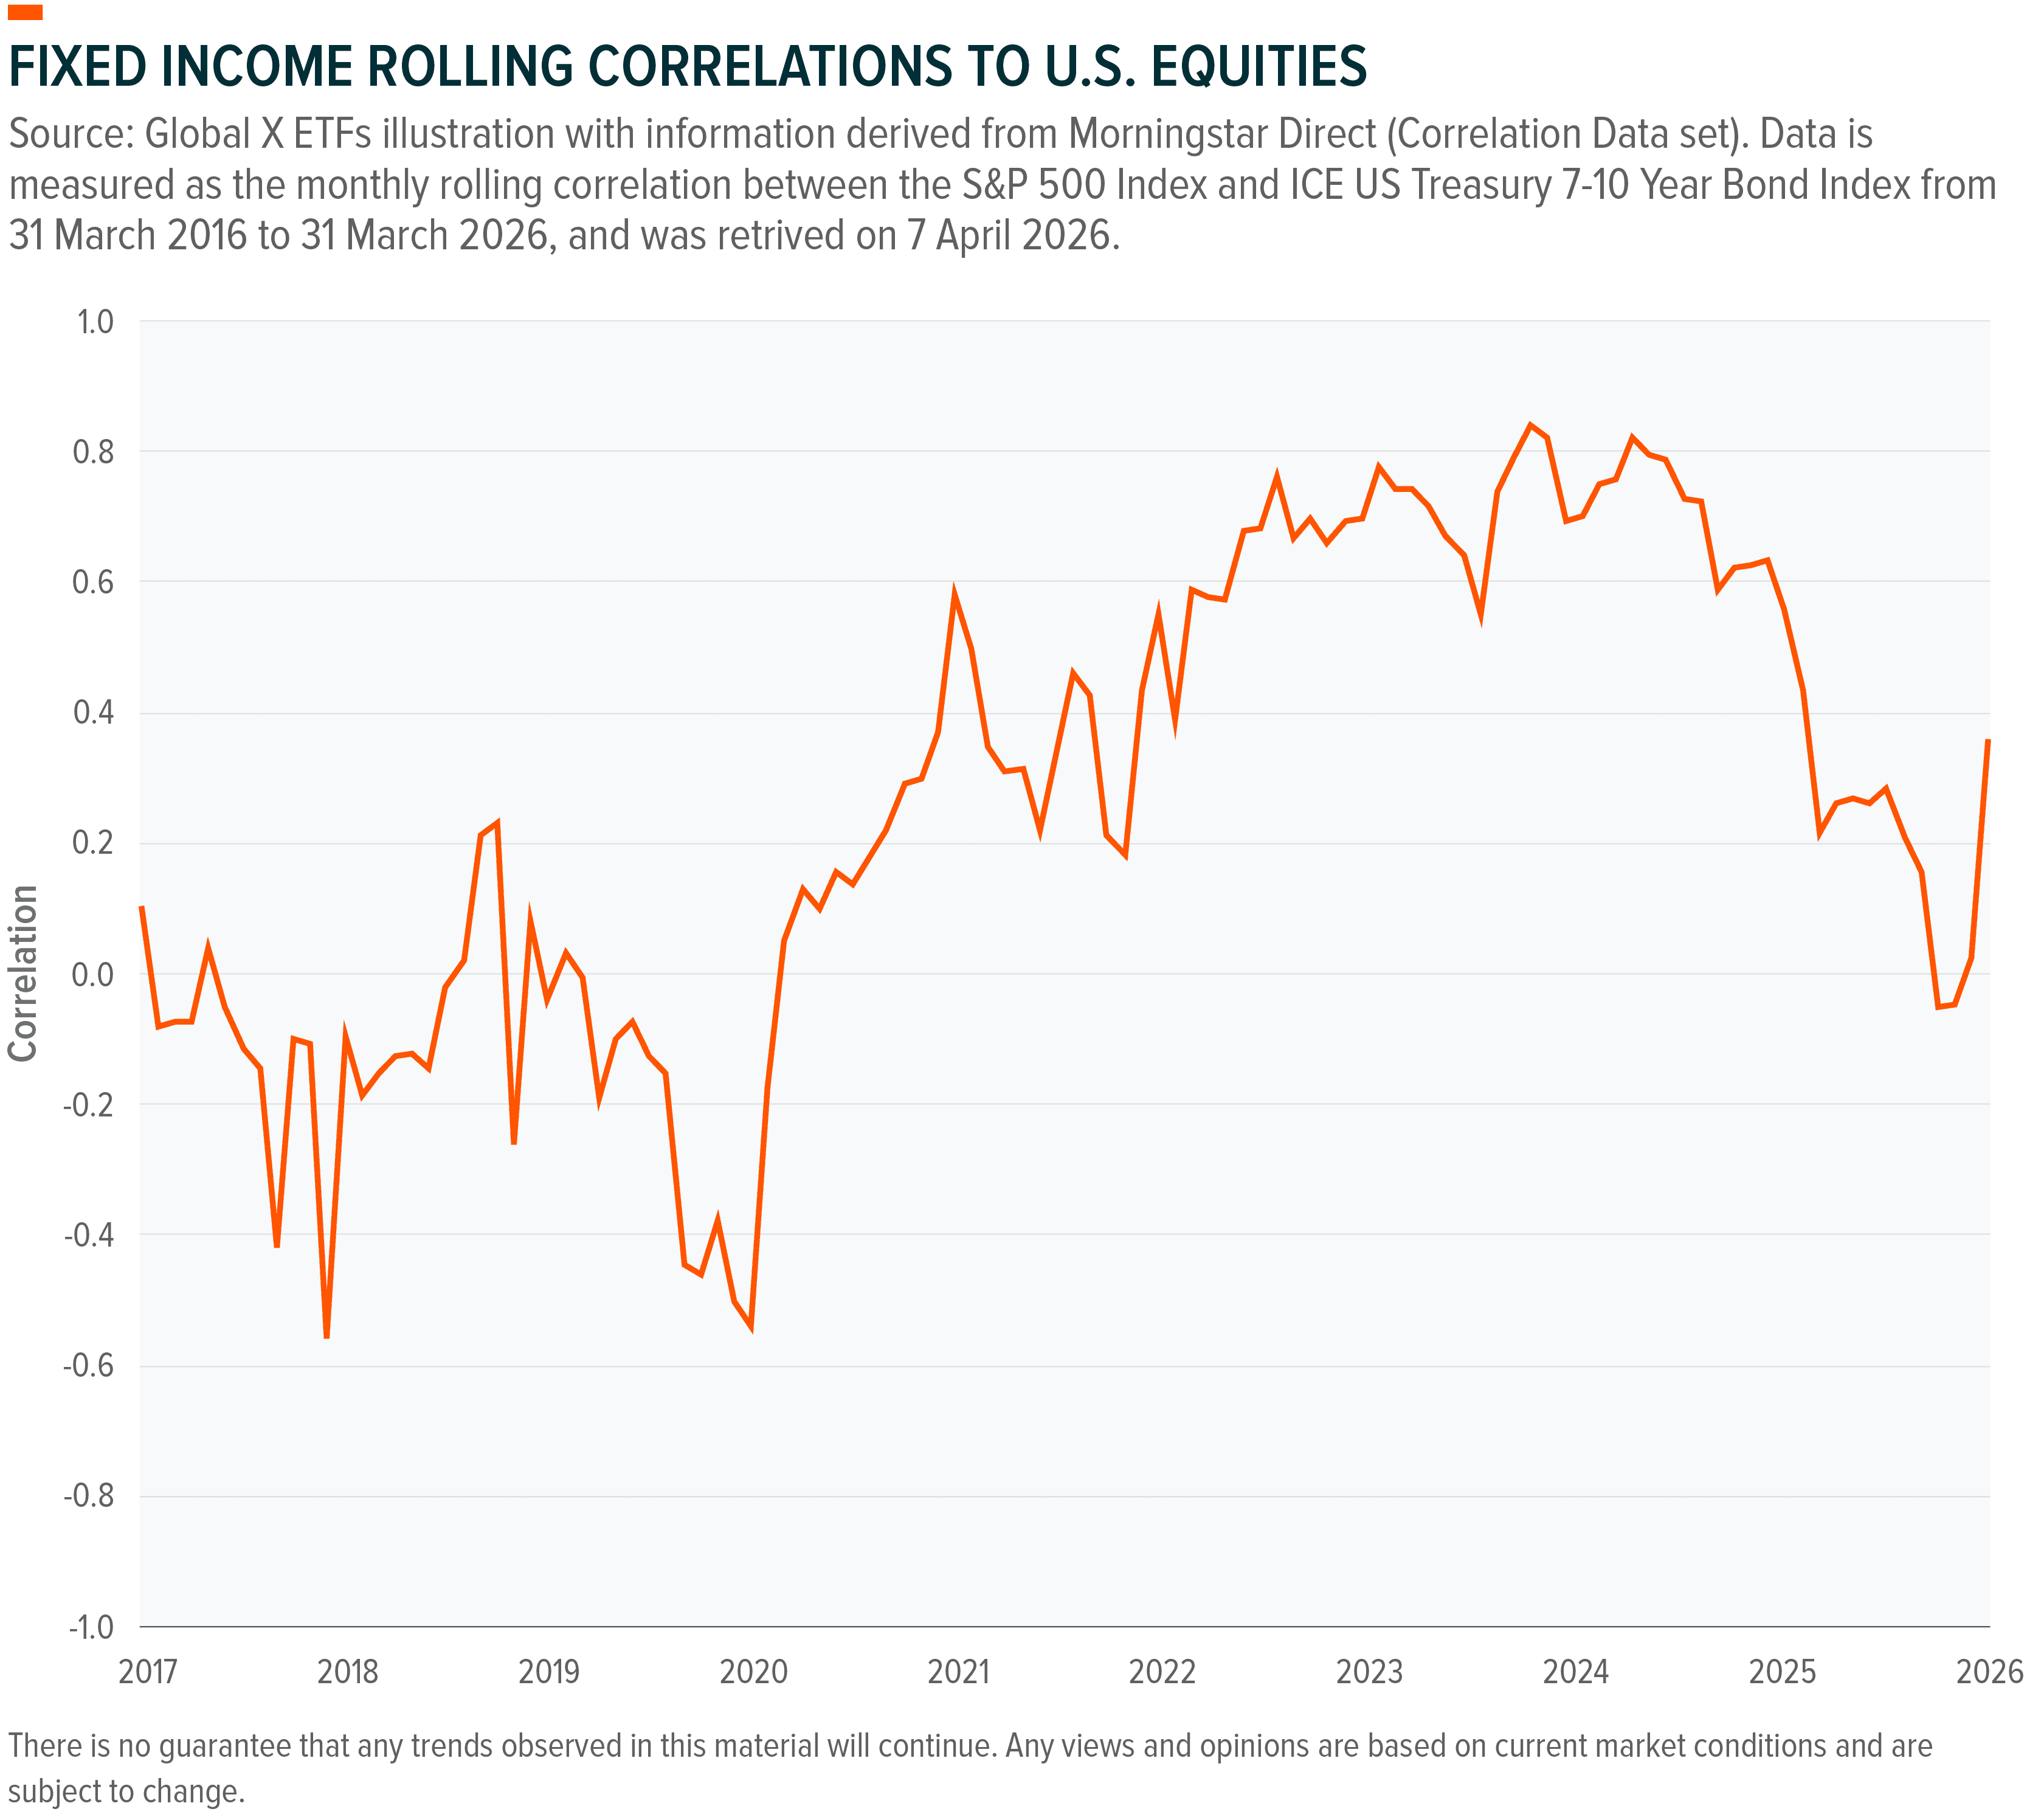
From 2017 to 2020, the rolling equity-bond correlation oscillated around zero and into negative territory, the textbook behaviour that underpins the 60/40 construction and its promise of diversification in times of crisis or volatility.⁵ That regime ended abruptly as inflation accelerated and central banks responded with the most aggressive rate-hiking cycle in four decades.⁶ The correlation surged to above 0.8, with equities and bonds selling off in lockstep and eliminating the cross-asset hedge in moments where allocators needed it most.⁷ The subsequent partial reversion in correlation offered no hedging effect of bonds against equity downside risk during the Feb-Apr 2025 Trade War sell-off.⁸ Bonds are more attractive on yield today than they were in 2021, but again their ability to reliably offset equity drawdowns remains conditional in a way that historical models tend to understate as we are now witnessing during the ongoing conflict in Iran which is bringing the stagflation narrative to the forefront again.⁹
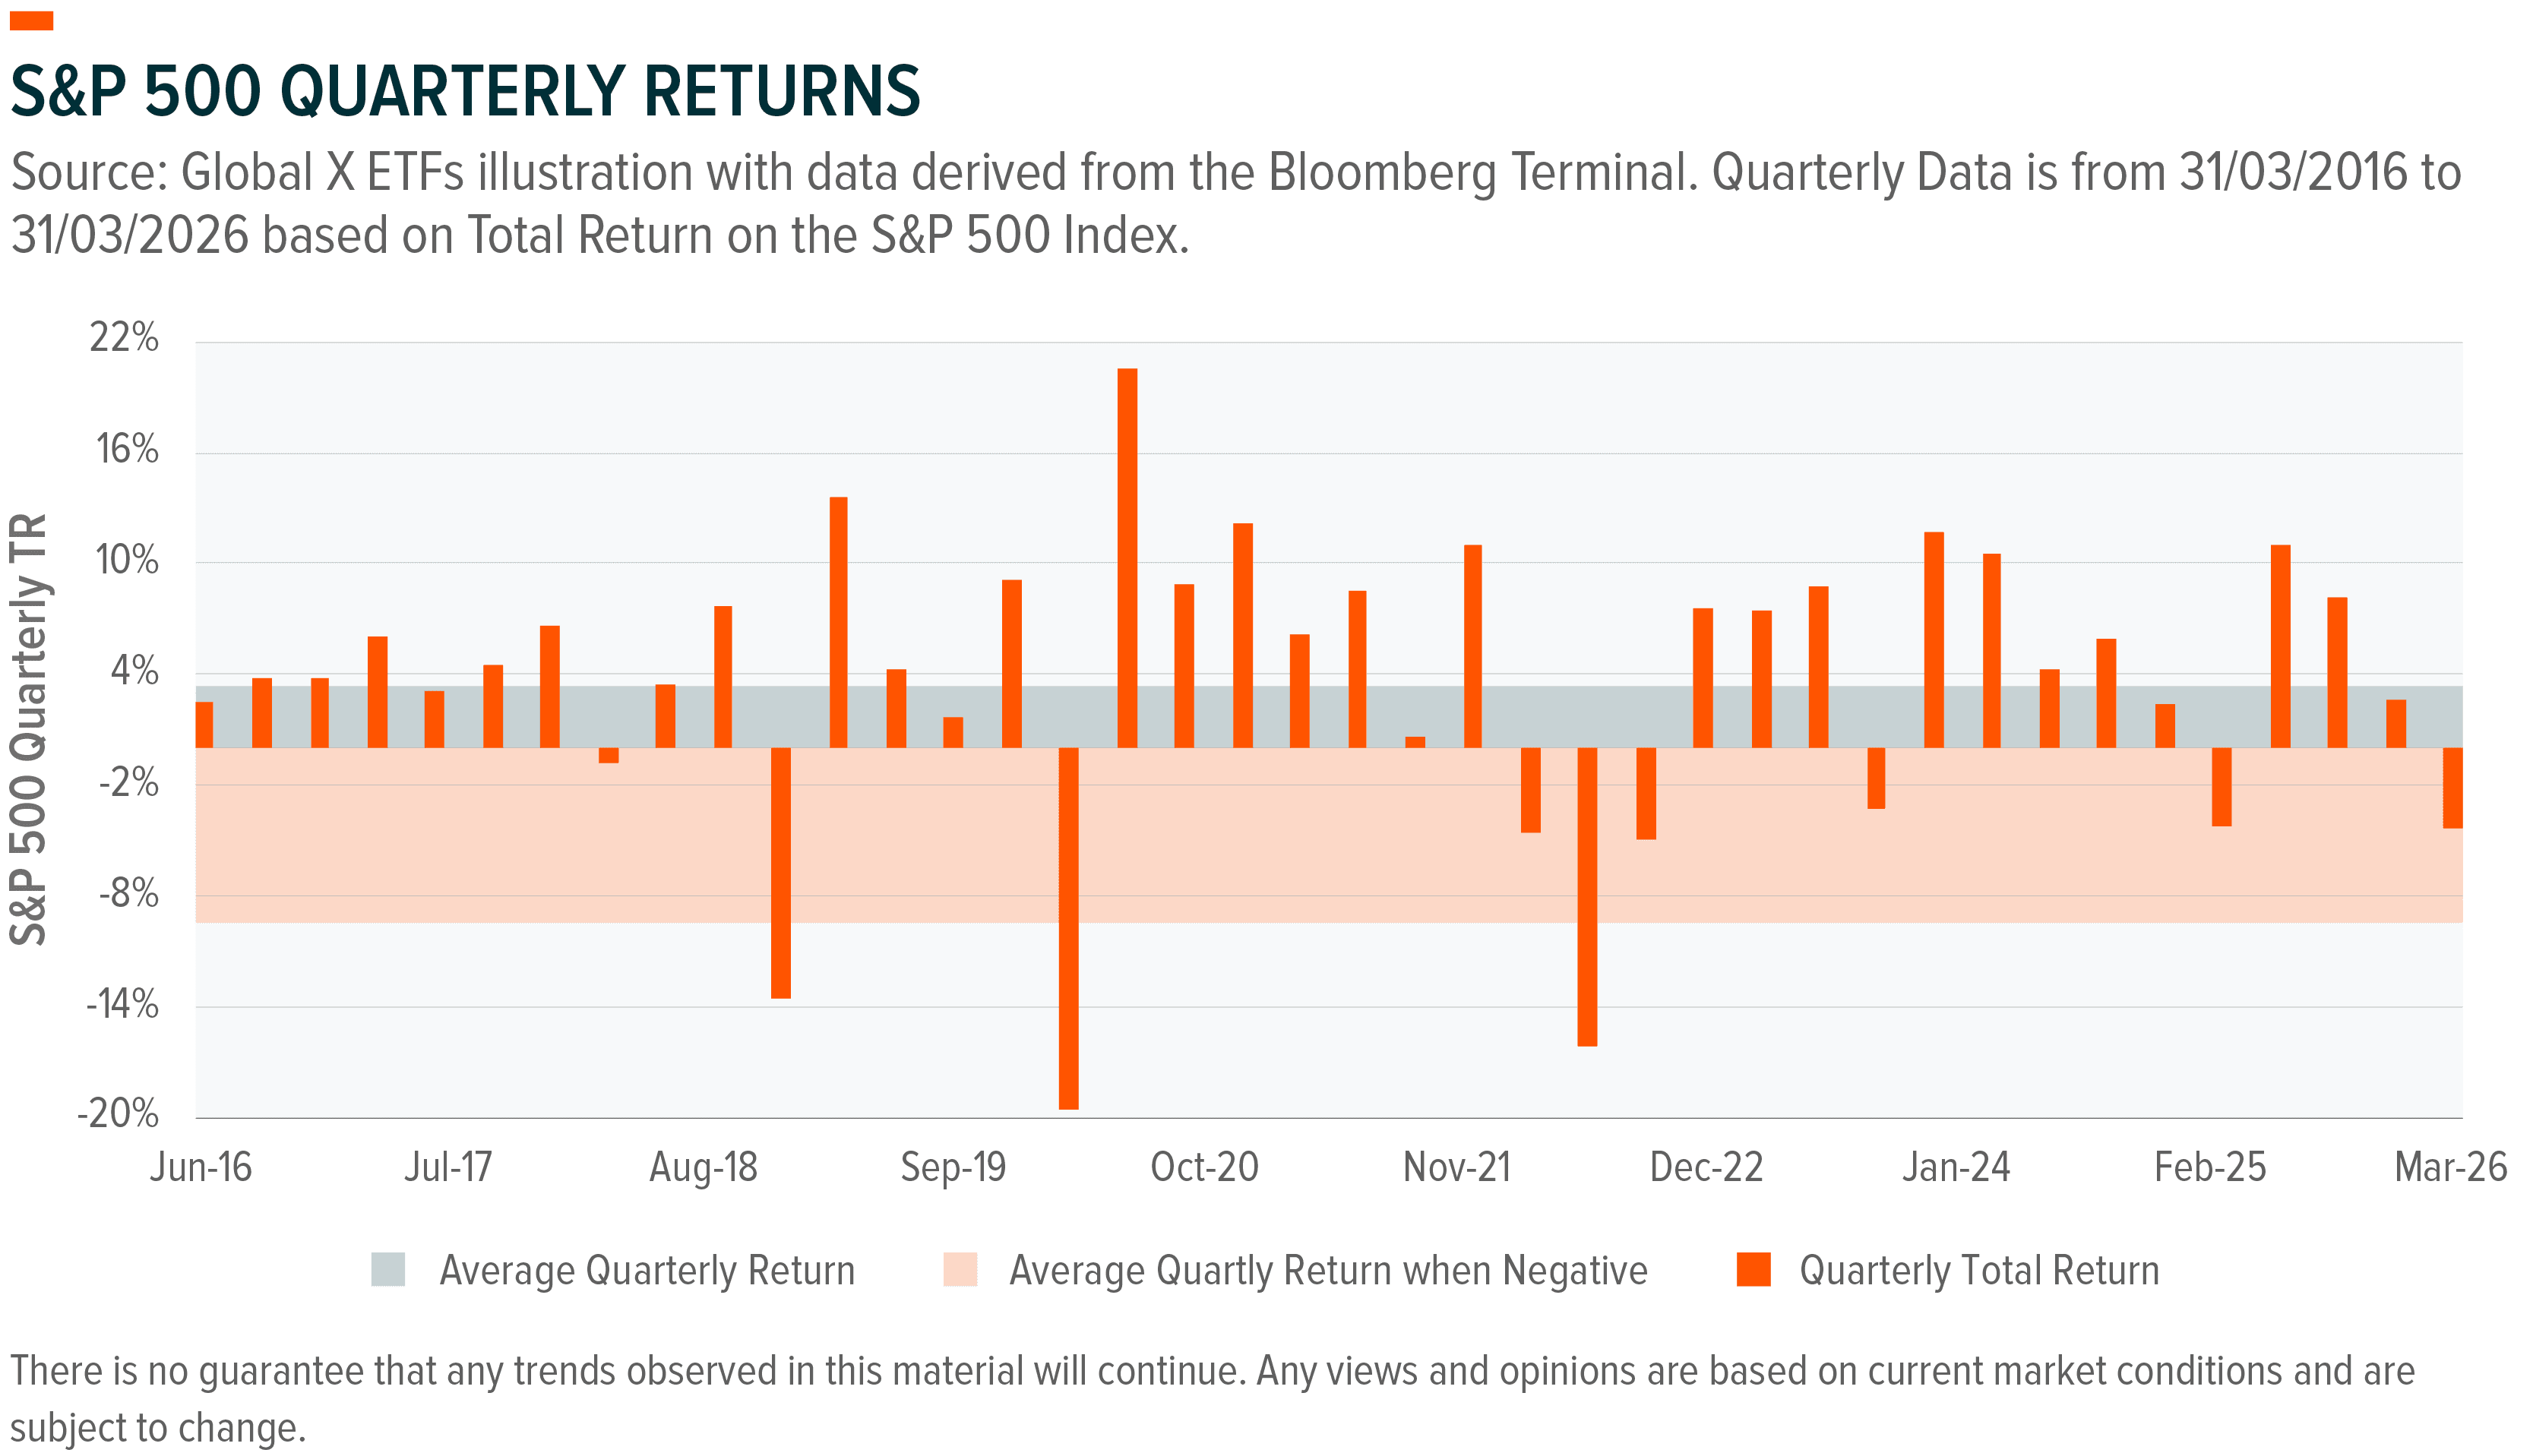
At the same time, equity valuations can have limited margins of safety. As seen through recent drawdowns, shifts in sentiment can lead to rapid declines, highlighting an inherent asymmetry where upside may be more limited than downside risk following periods of momentum price trends.¹⁰
Defined outcome strategies may be suitable in such environments where traditional portfolio construction tools are limited. The cost of protection matters and the ability to deliver predictable outcomes is valuable regardless of market direction.
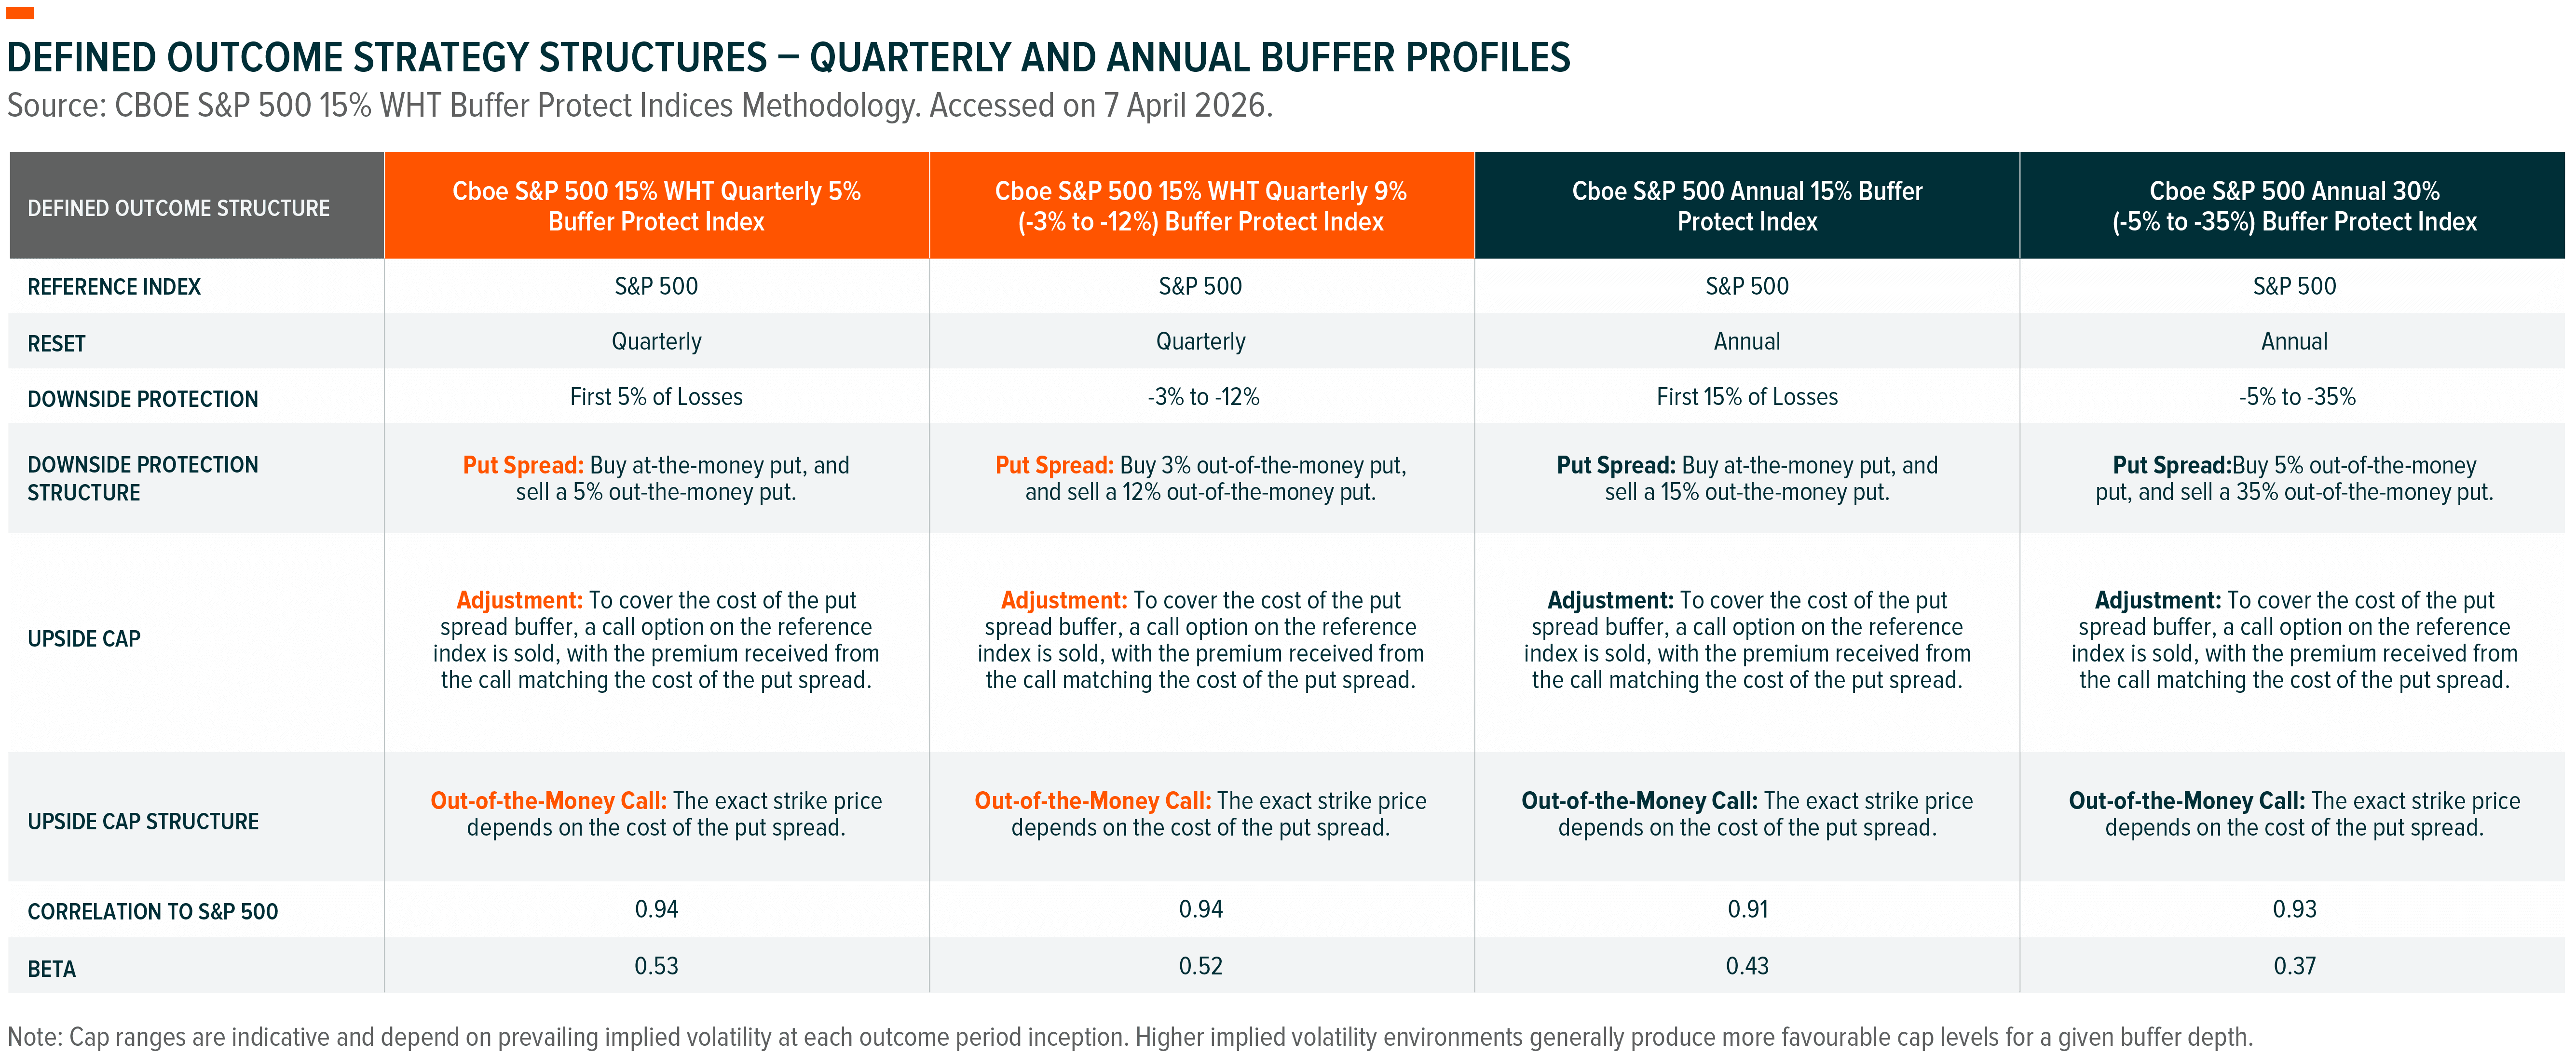
A defined outcome strategy combines equity market exposure with an options overlay, oftentimes with a zero-cost option premium structure, to deliver a specified level of downside protection with upside participation up to a cap. The structure typically has three components:
The result is a strategy that participates in equity market gains up to the cap, is protected from losses within the buffer range, and participates in losses beyond the buffer on a broadly one for one basis. Both the buffer depth and the cap level are determined by the prevailing options surface at inception. A higher implied volatility at the start of an outcome period typically produces a higher cap for any given buffer level, all else equal. Extending the buffer depth requires purchasing a put spread with a wider strike differential. This increases the net option debit of the protection leg, which in turn requires the financing call to be placed at a lower strike to generate sufficient premium, thereby reducing the cap. The relationship is systematic and directly quantifiable at inception via the prevailing options surface.
Defined outcome strategies are typically implemented with quarterly or annual resets, and the choice carries meaningful implications for portfolio outcomes.
A quarterly structured buffer, for example with a 5% buffer, protects against losses each quarter while capping upside participation over the same period. It may appeal to investors seeking to reduce equity beta while resetting protection and upside parameters more frequently. The shorter outcome period may result in a more favourable cap-to-buffer trade-off.
An annual structure extends the same framework over 12 months, typically structured with a deeper buffer in exchange for a lower relative cap to buffer ratio and less frequent resets. It may be better suited to investors with a medium-term horizon seeking more meaningful downside protection while maintaining equity exposure.
The first and most consequential decision is how the strategy is positioned within the broader mandate.
As a tactical overlay, buffer strategies are deployed in response to elevated near term risk ahead of identifiable event risk, during periods where the options surface is pricing elevated implied volatility, or to reduce portfolio beta through a period of concentrated equity momentum. The strategy is sized as a partial replacement of unhedged equity exposure.¹⁴
As a strategic allocation, buffer strategies occupy a permanent sleeve within a multi asset portfolio, typically replacing a defined proportion of unhedged equity exposure in mandates where drawdown constraints are formally binding, or where the primary objective is capital preservation with equity participation rather than unconstrained total return.¹⁵
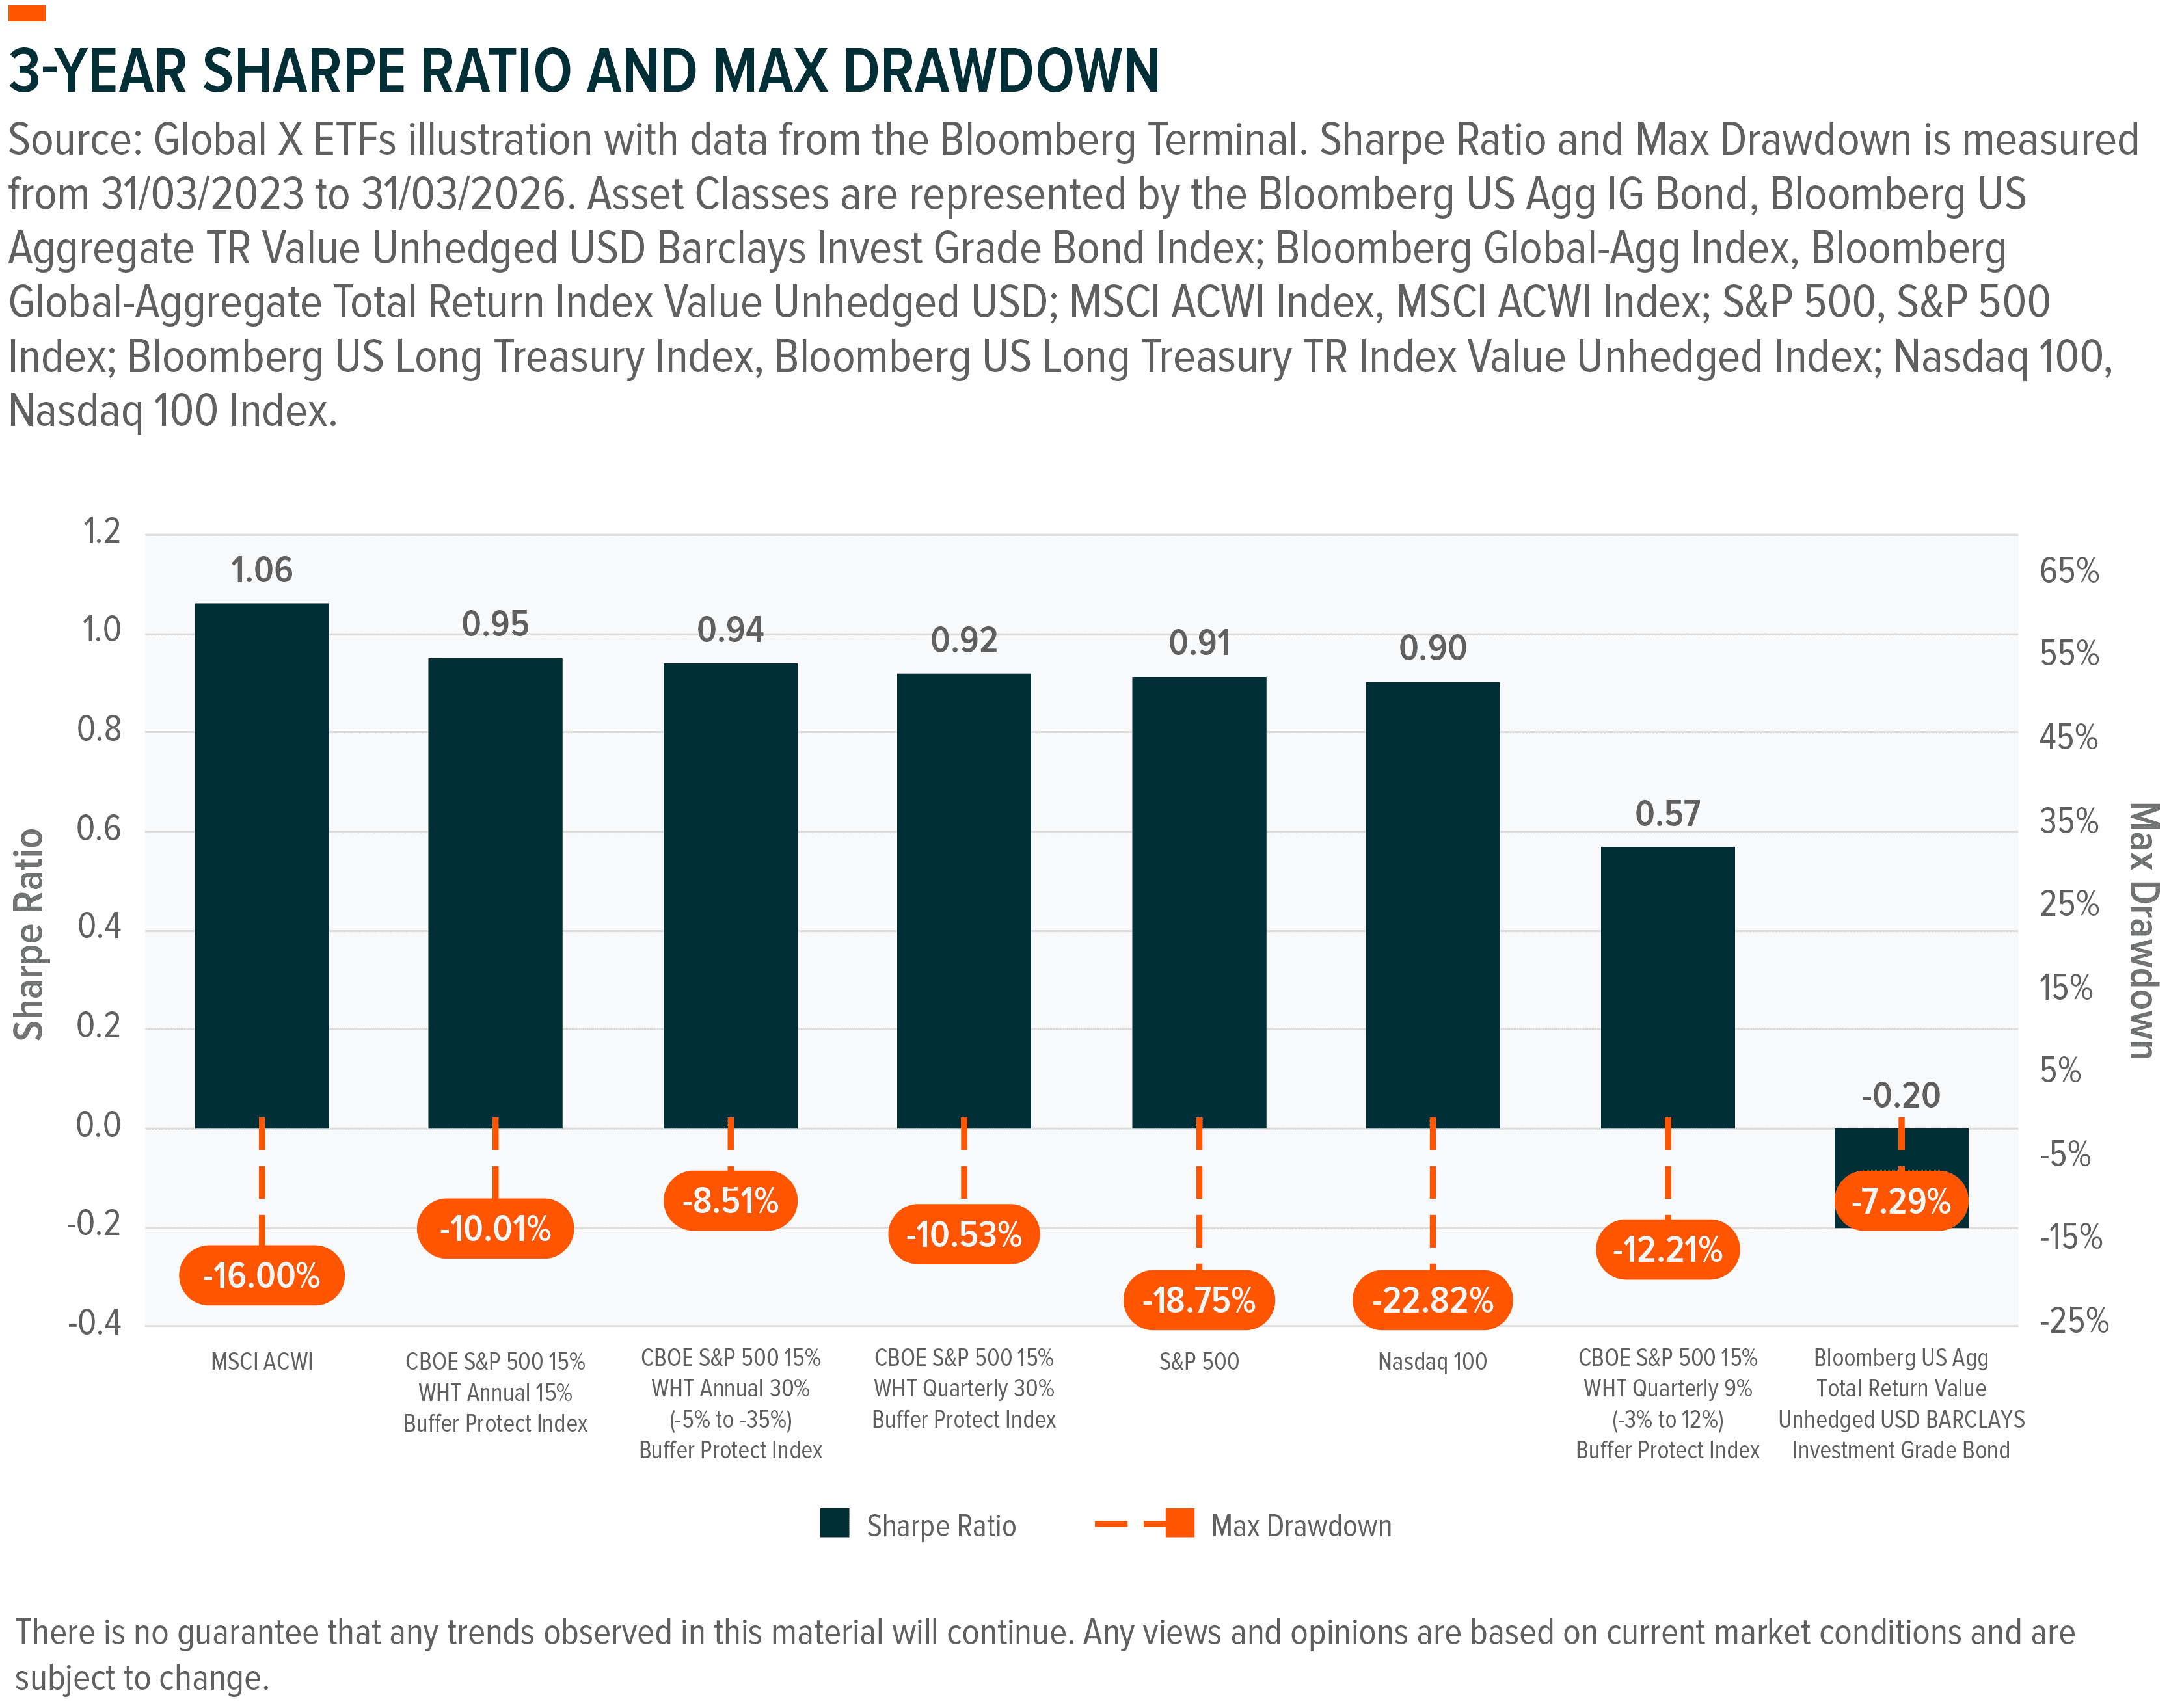
Buffer strategies serve as an equity risk management tool, with sizing based on the equity sleeve and designed to act as a de-risking mechanism.
Using the empirical risk profile of the Cboe S&P 500 15% WHT Quarterly 5% Buffer Protect Index which tracks a 5% quarterly buffer strategy as an example, it has an annualised beta of approximately 0.6, upside capture of approximately 50%, and downside capture of about 48% over a ten-year period illustrates the systematic performance of this options architecture across different market regimes.
Defined outcome strategies have moved past early cycle adoption. The category now exceeds $78 billion in assets under management across more than 420 exchange traded funds globally, having compounded at an average annualised organic growth rate of 39% over the preceding three years.¹⁶ Cerulli Associates projects the category may reach $334 billion globally by 2030, a 35% compound annual growth rate, more than twice the projected expansion of the broader ETF industry, driven by a generational shift in investor priorities toward capital preservation and predictable outcomes.¹⁷
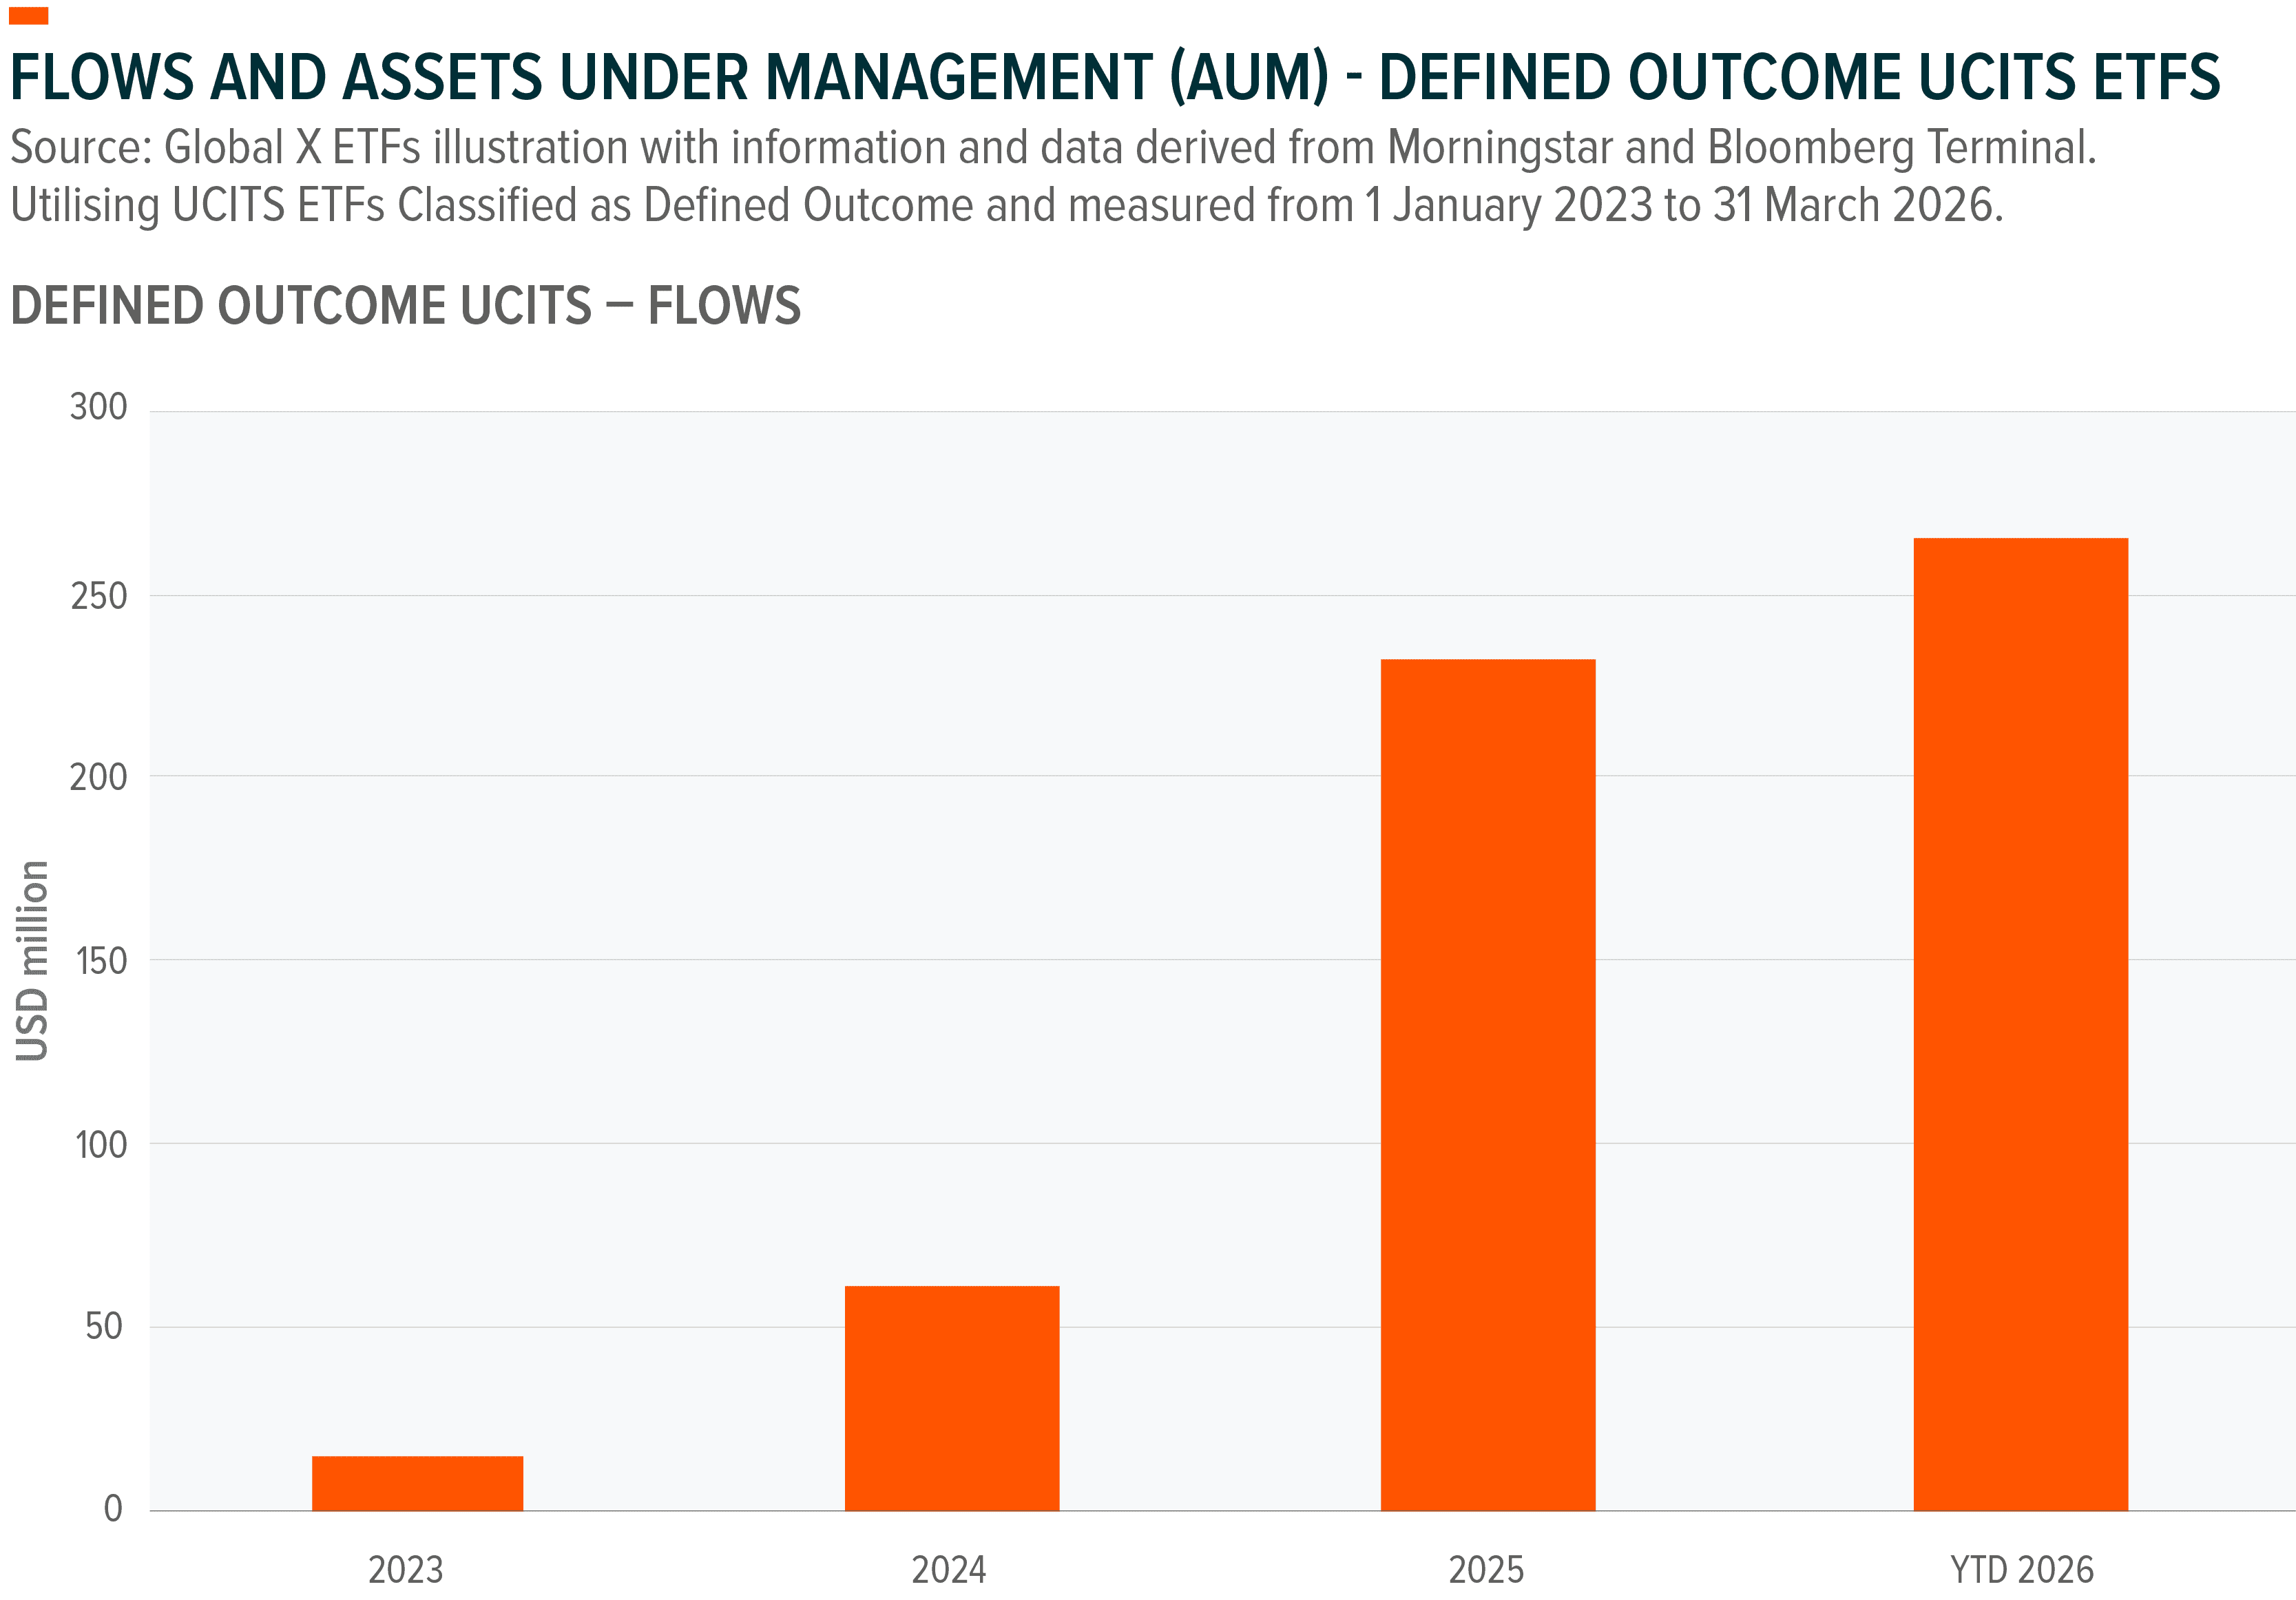
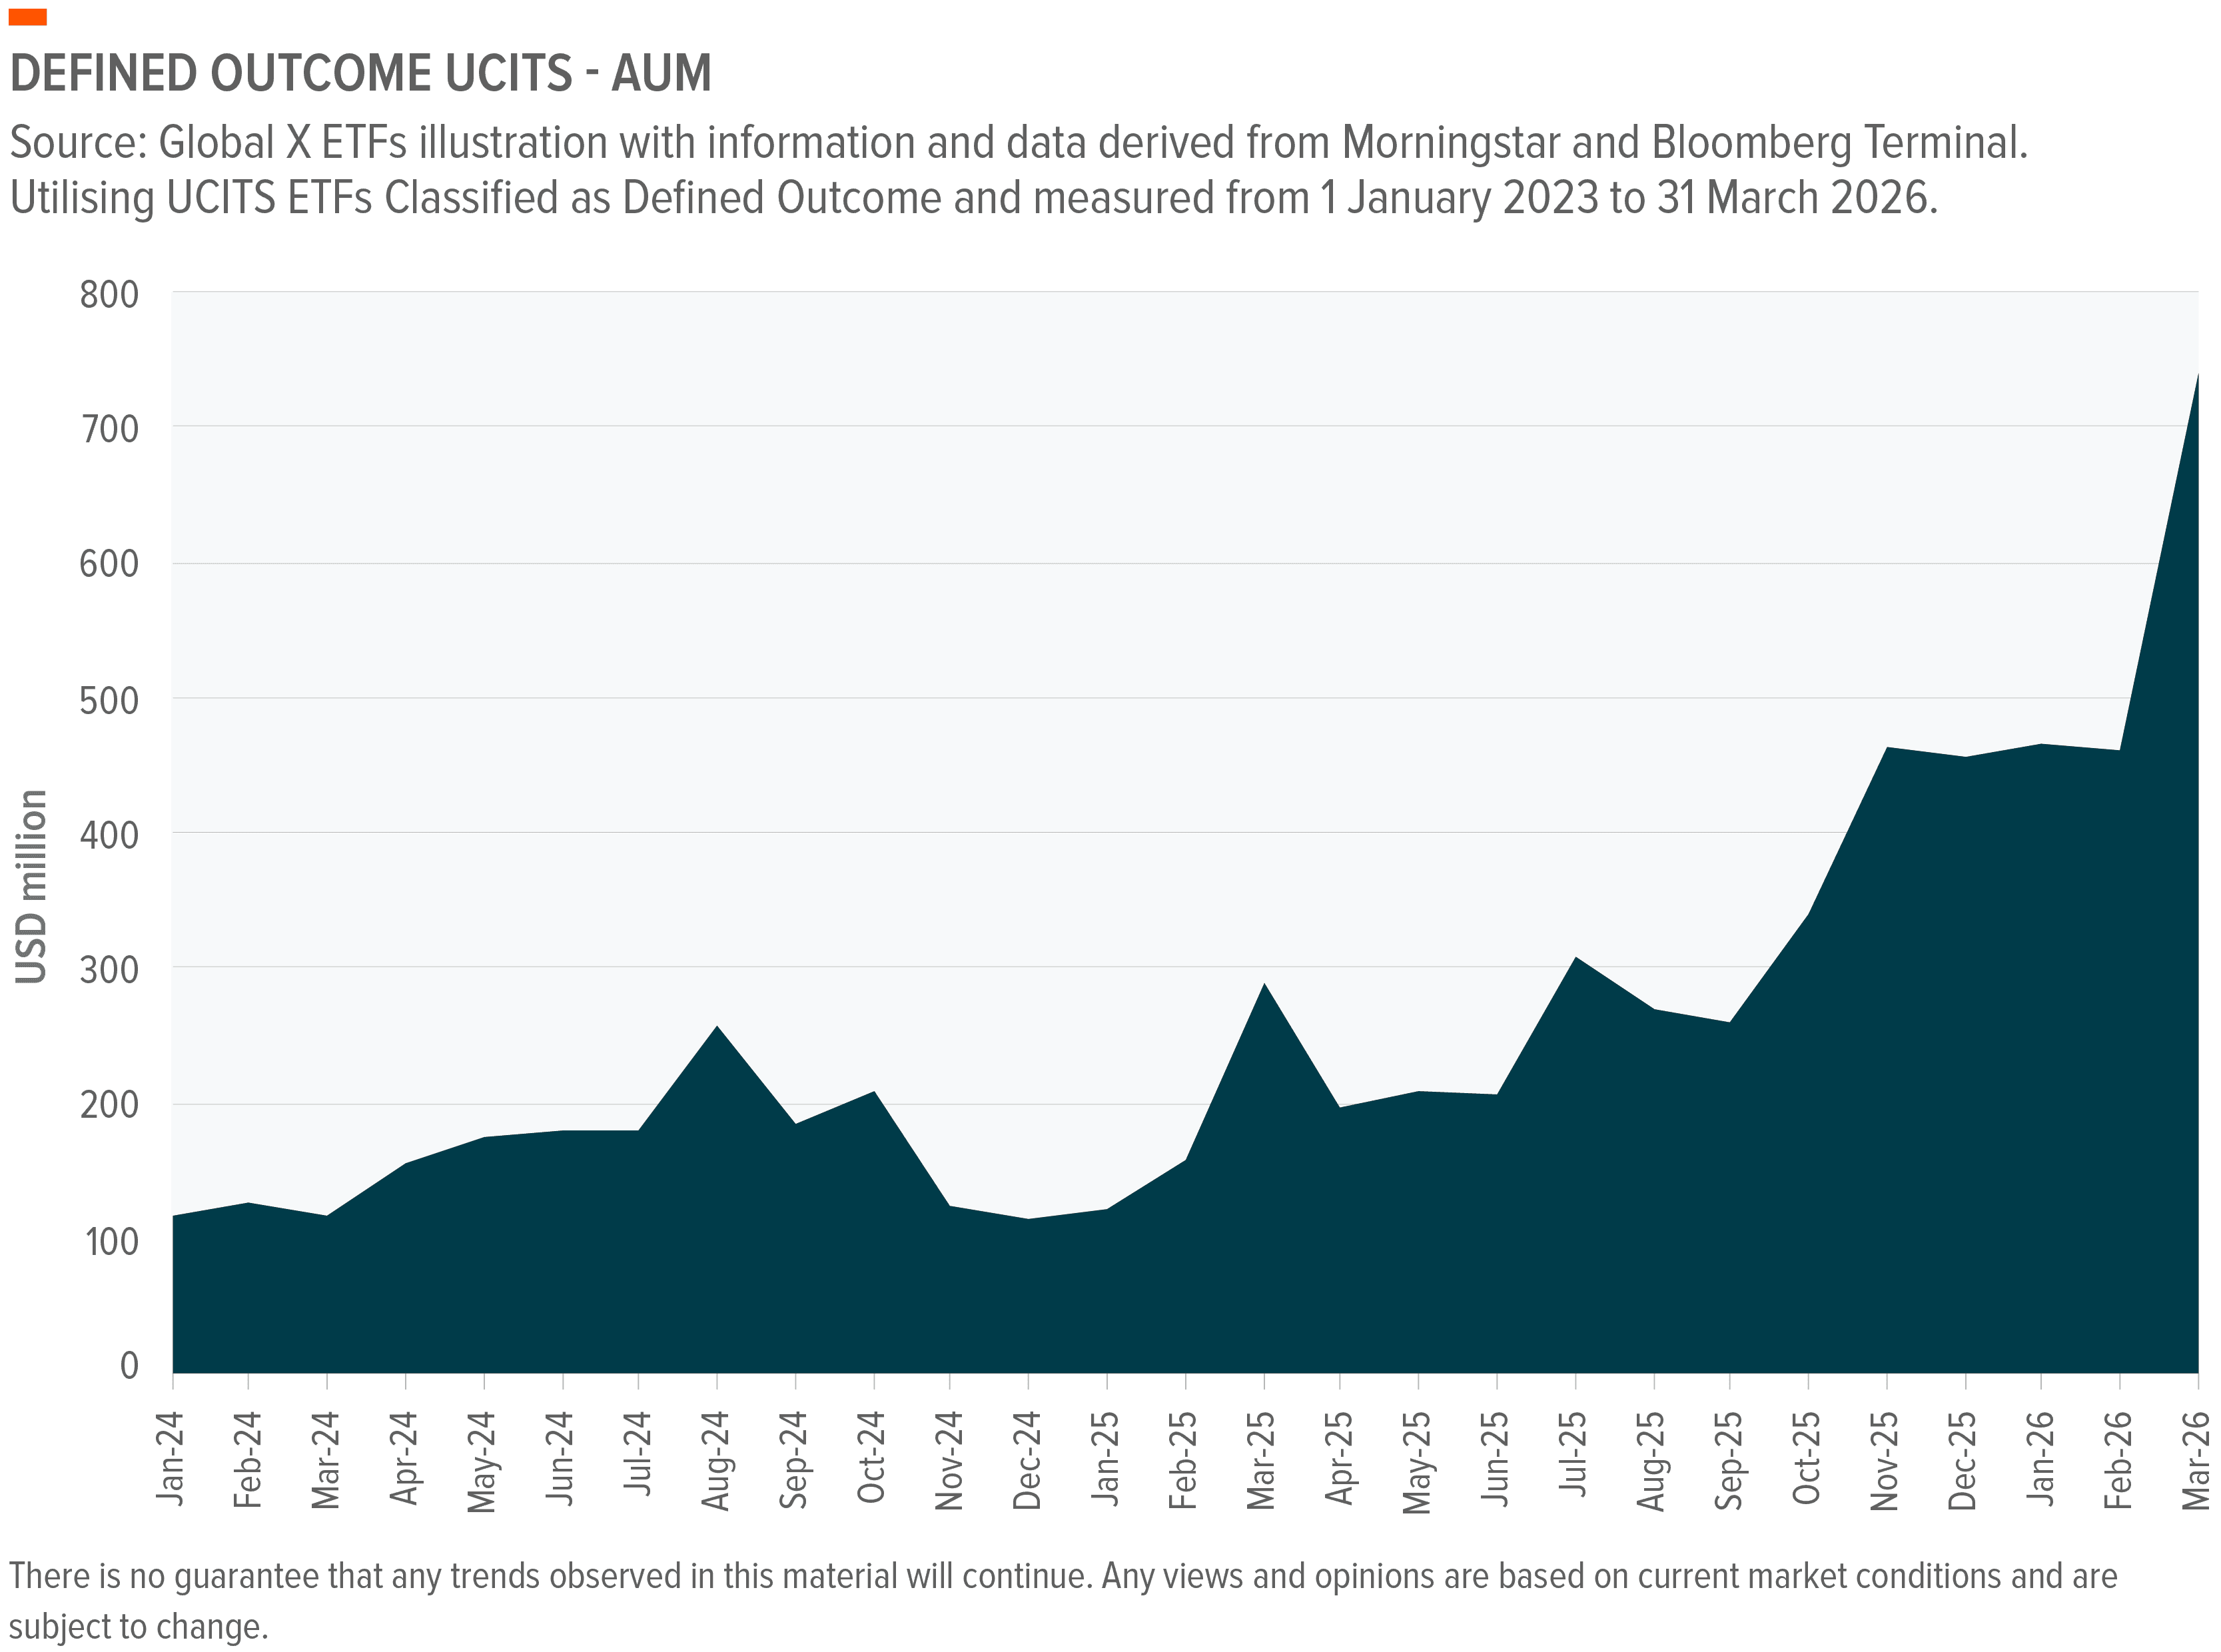
Further the Brown Brothers Harriman (BBH) 2026 Global ETF Investor Survey, conducted across 325 professional investors globally, over half of whom manage in excess of $1 billion, found that 26% of investors plan to increase defined outcome ETF allocations in the next 12 months.¹⁸ In the US specifically, defined outcome ETFs were the top pick for investors at 37% and ranked high 54% among strategies most likely to be used to manage volatility over the next 12 months.¹⁹ Europe is at an earlier stage but is accelerating rapidly, as reflected in the AUM and flow trends for UCITS ETFs shown below. The same BBH survey indicates that 26% of European investors plan to allocate to buffer ETFs in 2026.²⁰ This reflects a category that may have the potential to be structurally embedded within institutional portfolios beyond a tactical allocation.
Defined outcome strategies are not a reaction to a single market episode, but a potential structural portfolio tool suited to environments characterised by elevated equity valuations, weaker cross-asset diversification, and event-driven drawdown risk that are difficult to time.²¹ In this context, traditional hedges may have become less reliable. Bonds in a more inflationary regime, may no longer offer consistent protection against equity downside, while other diversifiers have also struggled to perform in risk-off environments. They can serve as a longer-term portfolio tool in an environment marked by high equity valuations, weaker diversification across assets, and drawdown risks that are hard to time.
This document is not intended to be, or does not constitute, investment research as defined by the Financial Conduct Authority.
1. Global X ETFs with information derived from Morningstar Direct (Correlation Data set). Data is measured as the monthly rolling correlation between the S&P 500 Index and ICE US Treasury 7-10 Year Bond Index from 31 March 2016 to 31 March 2026, and was retrieved on 7 April 2026.
2. Brown Brothers Harriman. 2026 Global ETF Investor Survey: Uncharted opportunity. 3 March 2026.
3. Callan. Unprecedented Territory and the Inherent Limits of Diversification. Accessed 8 April 2026.
4. Stern, NYU. Historical Returns on Stocks, Bonds and Bills: 1928-2024. January 2026 and Accessed on 8 April 2026.
5. Global X ETFs with information derived from Morningstar Direct (Correlation Data set). Data is measured as the monthly rolling correlation between the S&P 500 Index and ICE US Treasury 7-10 Year Bond Index from 31 March 2016 to 31 March 2026, and was retrieved on 7 April 2026.
6. Statista. The Most Aggressive Tightening Cycle in Decades. 14 December 2023.
7. Global X ETFs with information derived from Morningstar Direct (Correlation Data set). Data is measured as the monthly rolling correlation between the S&P 500 Index and ICE US Treasury 7-10 Year Bond Index from 31 March 2016 to 31 March 2026, and was retrieved on 7 April 2026.
8. CEPR. How the tariff war shock affected the ‘safe asset’ privilege of US Treasuries. 28 January 2026.
9. Jackson, G. Five things investors need to know about bonds in the Iran crisis. 16 March 2026.
10. Marques, L. Cornell University. Sentiment Feedback in Equity Markets: Aymmetries, Retail Heterogeneity, and Structural Calibration. 15 September 2025
11. Cboe S&P 500 15% WHT Buffer Protect Indices. Accessed 14 April. 2026
12. Ibid.
13. Ibid.
14. InvestmentNews. Why wealth managers are swapping money market funds for buffer ETFs. 18 February 2026.
15. ETF.com, Buffer ETFs Offer Strategic Ways to Hedge. 26 June, 2025.
16. Morningstar. Buffer ETFs are not for everyone. Here’s how to use them in your portfolio. 12 February 2026.
17. Cerrulli Associates. The Future of Outcome-Based Investing: How Defined Outcome ETFs Are Poised for Rapid Growth. 19 November, 2025.
18. Brown Brothers Harriman. 2026 Global ETF Investor Survey: Uncharted opportunity. 3 March 2026.
19. Ibid.
20. Ibid.
21. ETF.com, Buffer ETFs Offer Strategic Ways to Hedge. 26 June, 2025.