Sustainable Transition: The Opportunity in Renewable Energy
Planet Earth’s climate is changing for the worse. Heightened concentrations of atmospheric CO2 are driving long-term temperatures upward, resulting in negative environmental impacts that come with existentially concerning externalities. The causal relationship between human-produced greenhouse gas (GHG) emissions and such impacts is “unequivocal,” according to the International Panel on Climate Change’s (IPCC) landmark 2021 report (AR6).* However, just as human activity bears the onus of our current climate predicament, human innovation and investment could limit it from worsening. Decarbonization is among the most pressing and globally shared objectives of the 21st century. We can only achieve this by transitioning to clean and renewable energy sources, a shift which will require investing tens of trillions of dollars in the coming decades.
In the following piece, we investigate the global climate crisis and evaluate the role clean and renewable energy sources are and will play in addressing it.
- Heightened levels of atmospheric CO2 and related temperature increases threaten lives, livelihoods, and Earth’s natural environment. Renewable energy and clean technologies are the best tools available to limit further impacts.
- Limiting warming to 1.5 °C above preindustrial levels through emissions reductions can mitigate many of the negative impacts of climate change. This would entail tens of trillions of dollars of investment in renewable energy and clean technologies.
- Renewable and clean energy sources are continuing to gain share on fossil fuel-based sources as related technologies become more affordable. We expect to see continued penetration, driven by electrification, economies of scale, and climate action.
Setting the Stage: The Global Climate Crisis
Temperatures on Earth are reaching new heights. The past four decades were successively hotter than all preceding ones dating back to at least 1850, and the average temperature from 2011-2020 was ~1.09 °C warmer than that of 1850-1900 (preindustrial period).1 Almost all of this warming is the direct result of heightened atmospheric GHG concentrations, primarily of CO2, irrespective of source (human-produced or not).2,3 GHGs act as atmospheric insulators, absorbing heat from the Earth’s surface and releasing it over time. Naturally occurring GHGs are what kept the planet warm enough for habitation and were regulated by ocean absorption and plant photosynthesis. Today, though, GHG levels are far from natural and the planet cannot keep up.
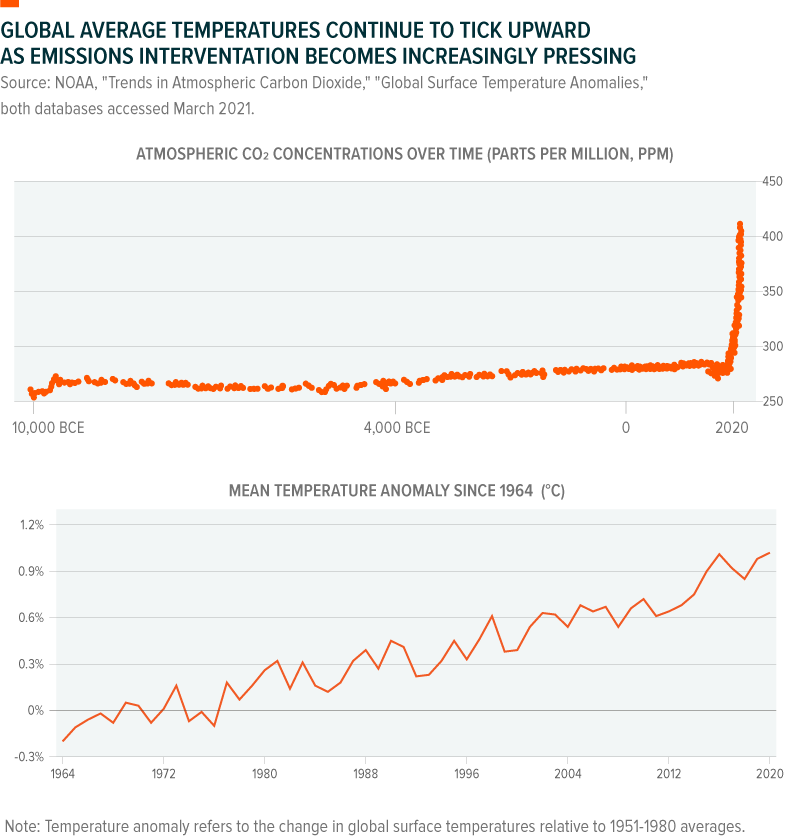
Atmospheric data reveal that the average concentration of CO2 from 2010-2019 was 43% higher than the preindustrial average, increasing from 289.3 parts per million (ppm) to 410 ppm.4 This increase occurred 100x faster than any known natural increase, including the several-thousand year period that ended the most recent ice age.5 And in 2019, CO2 concentrations reached levels higher than at any point in the past 2 million years.6 That this began shortly following the industrial revolution in the 20th century is no coincidence. Anthropogenic (human-produced) emissions are almost solely responsible for heightened GHG levels and resulting temperature increases (+/- 0.1°C to account for the presence/lack of natural GHGs). The burning of fossil fuels for energy is the primary culprit. Since 1990, fossil-fuel energy sources produced 74% of annual CO2 emissions, on average.7,8
The impacts of emissions and warming are already in effect, and all at once:9
- The intensity and frequency of extreme temperatures and heatwaves on land have increased since the 1950s, while ocean heatwaves have doubled since the 1980s.
- Heavy precipitation events have become more frequent and intense since the 1950s. Somewhat counterintuitively, agricultural and ecological droughts have also increased since then as a result of warmer temperatures.
- Over the past 100 years, oceans warmed faster than they did in the 11,000 years prior, resulting in retreating glaciers and melting sea ice. Relatedly, sea levels rose faster than over any comparable time-period in the 3,000 years prior. Oceans are also getting more acidic due to heightened CO2
- Hurricanes have become more frequent over the past 40 years, beyond what can be explained by natural variability. Warmer oceans and rising sea levels make these storms more intense and damaging, also moving them northward as warmer temperatures introduce new breeding grounds.
Connected through the water cycle, among other systems, these impacts are resulting in devastation from natural disasters, water scarcity, and food shortages, all of which threaten lives, livelihoods, and global economies.10 This is just with ~1.1°C of warming. Under the emissions policies in place as of 2021, temperatures in 2100 could fall in the range of 2.1-3.9°C above preindustrial levels.11 Just 2°C of warming would significantly increase the intensity and frequency of extreme “once-every-ten-year” weather events, with extreme heat events occurring 5.6x more often and 2.6°C hotter, extreme precipitation 1.7x more and 14% wetter, and extreme droughts 2.4x more and 0.6 standard deviations drier (in terms of soil moisture).12 The impact on human life would be immeasurable. Clearly, current interventions are not enough.
Clean & Renewable Energy as a Solution to Climate Change
2016’s Paris Agreement formalised the legally binding goal of limiting warming to well below 2°C warmer than preindustrial levels. The agreement highlights 1.5°C of warming as an achievable objective that would drastically limit the above-mentioned impacts of climate change. Climate change has moved quickly since 2016 and the emissions pathway related to 1.5°C of warming is narrower than ever, according to AR6. Yet, AR6 still presents a 1.5°C scenario as achievable if emissions peak in the 2020s and decline to net-zero by 2050, after which net negative emissions, enabled by carbon capture technologies, would be required.13 The aggressive adoption of renewable energy production and clean technologies is essential to every step of this pathway.
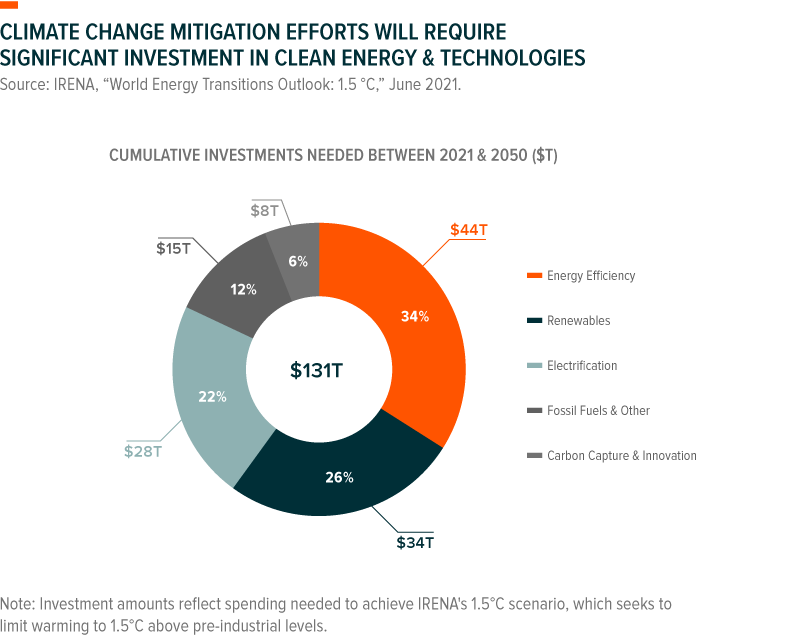
Existing legislation, commitments, and targets would require US$98T of total investment between 2021 and 2050, with US$10T directed to renewable energy, US$13T to renewable energy-enabling electric infrastructure for transportation and heat (see following section for explanation), US$32T to energy efficiency technologies, and the remainder to fossil fuels.14 While this is considerable and should benefit companies involved in producing renewable energy and clean technologies in the near- and long-term, acceptable warming paths will likely require substantially more. IRENA’s implementation-focused 1.5°C scenario estimates that overall investment should increase to US$131T over the same period, significantly increasing the proportions directed to renewable energy and electrification (see chart).15 By 2050, such investment, alongside prudent implementation, could bring net annual emissions down to -0.4 Gigatons of CO2 (GtCO2/yr), a significant improvement from the 36.5 GtCO2/yr that is likely on our current pathway.16
Since the adoption of the Paris Agreement, six countries passed carbon-neutrality targets into law, and five countries/regions, including the EU, Canada, and South Korea, have begun evaluating proposed legislation in the same vein. Twenty-four other countries, including United States and China (which together produce 36.8% of global emissions), have climate targets set as official policy, but have stalled on taking more meaningful action.17
Yet, we expect to see investment in renewables and clean technology above what current policy suggests, regardless of future government action. And while binding legislation and immediately observable action are what we hope for, these technologies make sense from an economic and business standpoint:
- Employment in the renewable energy sector is rapidly growing and should continue to increase as the transition away from fossil fuels continues (see following sections), especially in a world that is still reeling from the COVID-19 pandemic.
- Over 75% of the global population lives in a country that is a net importer of fossil fuels. For these people and countries, renewable energy could provide energy independence.18
- Renewable electricity is becoming cheaper than electricity produced by fossil fuels (see following sections). For this reason and others, companies like Amazon and Walmart, among others, have already announced plans to decarbonise using renewable energy and clean technologies.19
Solar Photovoltaic (PV) & Wind Power Are Driving the Renewable Energy Transition
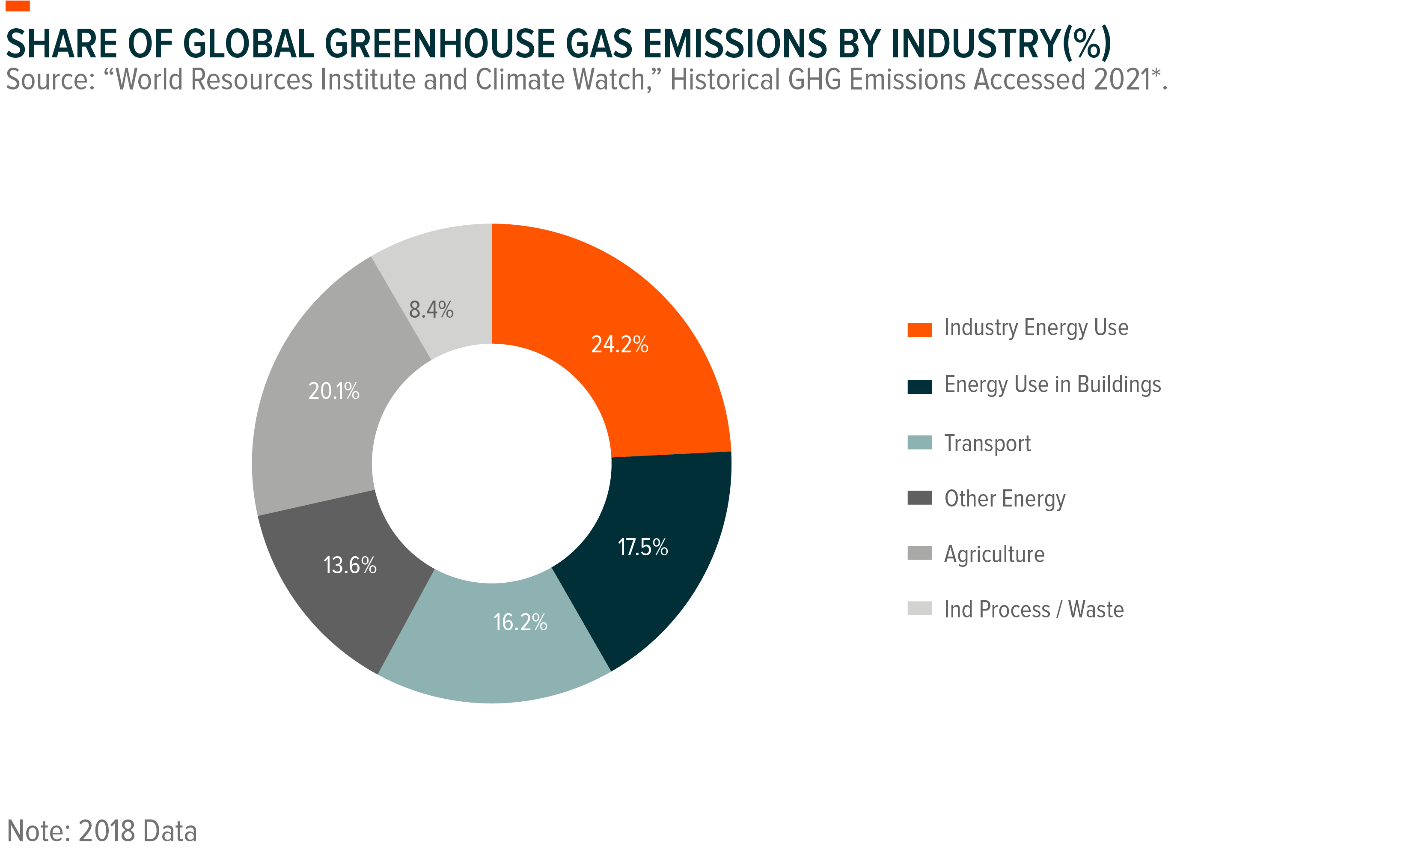
Electricity only represents 37% of total final energy consumption (TFEC), with the majority of this produced directly by the power sector. This means the remaining 63% of TFEC comes from the direct combustion of fossil fuels in transportation, buildings, and industry.20 Electrified end-uses can be decarbonised by transitioning the power sector to renewable energy sources, but for non-electrified end-uses like those just mentioned, decarbonisation is only possible through direct or indirect electrification. Direct electrification entails transitioning away from fossil fuel-powered vehicles and building heating systems to those that run on electric power. With this in mind, renewables and electrification should be viewed as complementary. Full renewable energy penetration can only be achieved through electrification, while further electrification is very dependent on renewable electricity. Following this thread, further scaling electrification and renewable energy production can play an outsized role in helping achieve global carbon neutrality goals. According to some estimates, substituting fossil-fuels like coal, oil, and natural gas with clean alternative energy sources could reduce emissions by 52% of what is needed to adequately limit warming. 21
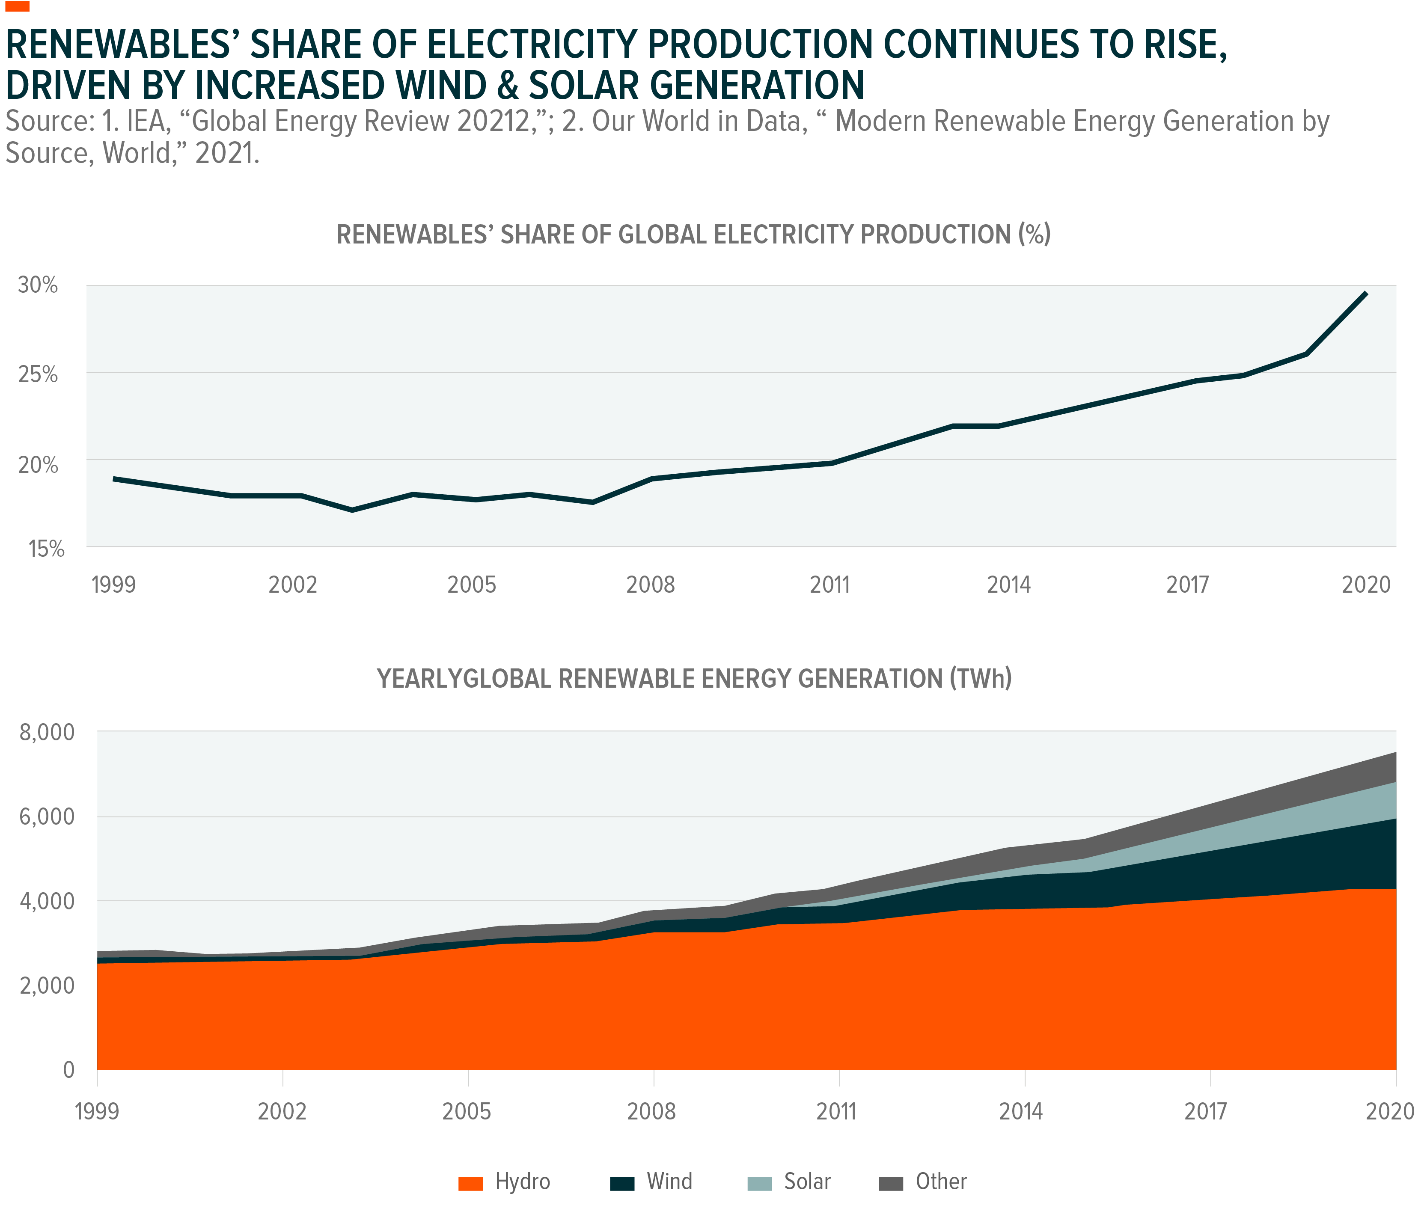
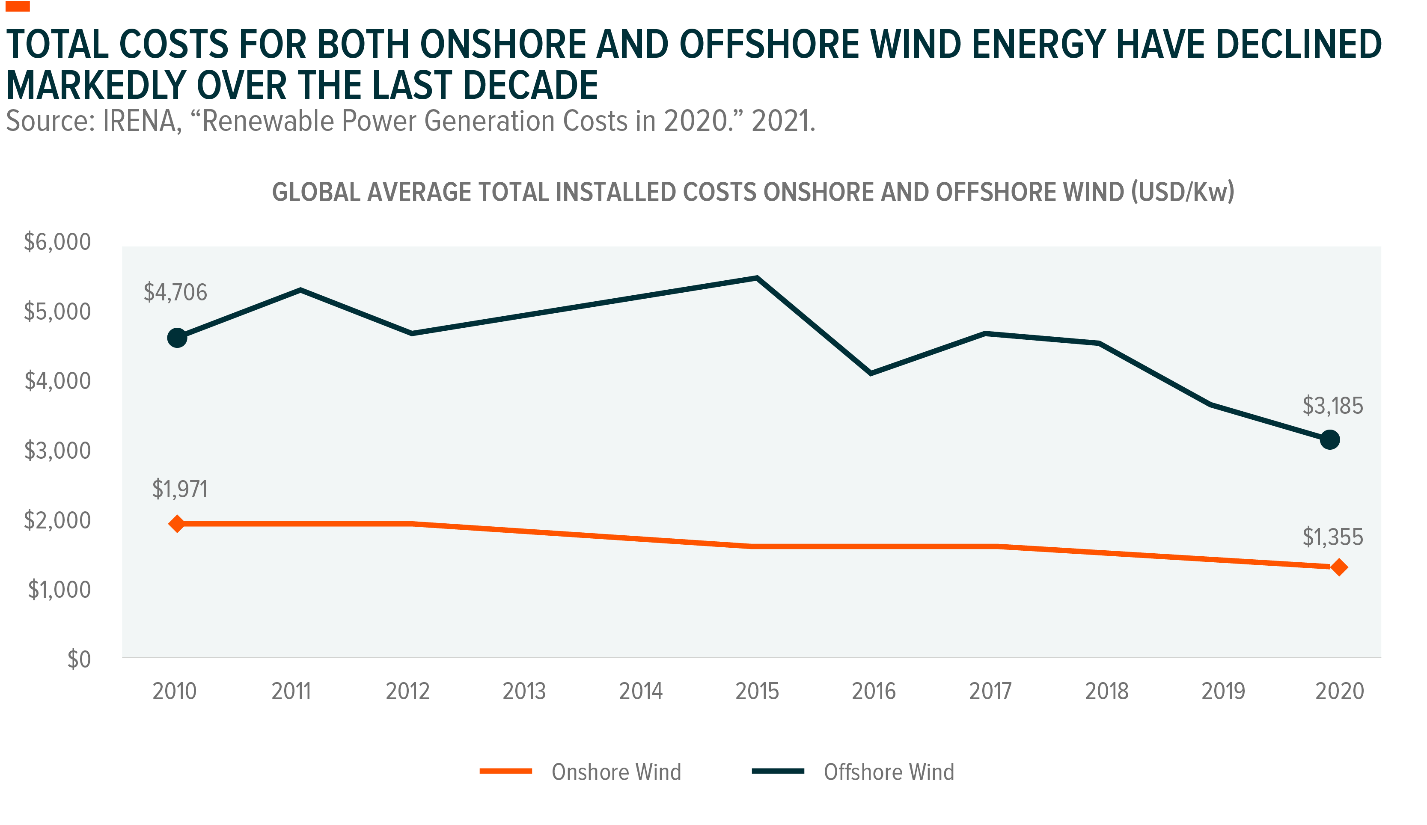
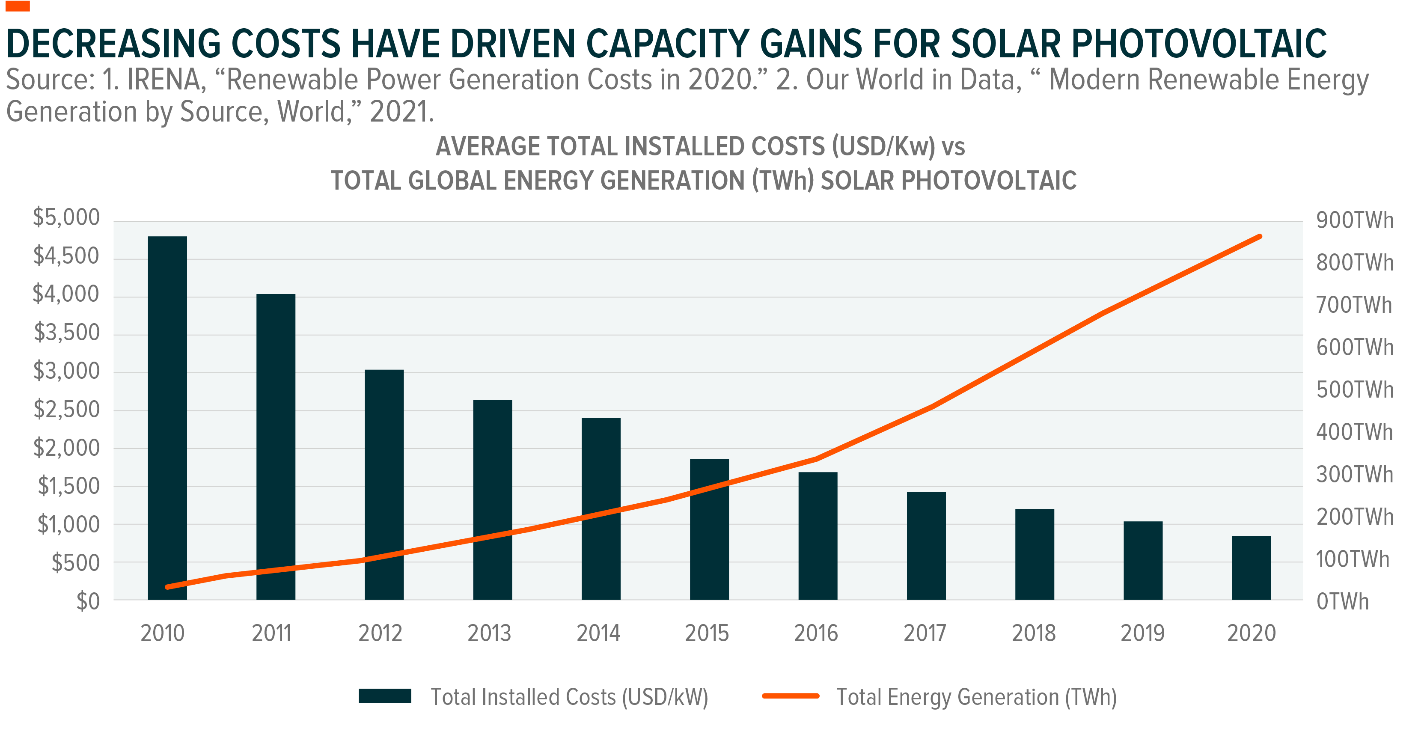
Clean energy sources’ share of global electricity production in the power sector continues to gain on emissions-producing fossil fuels. Renewables’ share of global electricity generation reached 29% in 2020, 2% more than at the end of 2019 and almost 10% more than at the end of 2010.22 In the past, hydroelectric sources like dams and run-of-the-river power generators represented the lion’s share of renewables in the overall energy mix. But much of the recent growth in renewable energy capacity can be attributed to innovation and rapidly decreasing costs of renewables like solar photovoltaic and wind power. But in the last decade, wind power and solar PV (solar power) drove the incremental growth of renewable energy capacity and generation, on the back of decreasing technology costs and supportive policy.
The levelized cost of electricity (LCOE) refers to the revenue required to build and operate a power source over a specified cost recovery period. Over the past ten years, the LCOE of solar PV and wind power decreased 80% and 55%, respectively, making them more affordable than fossil fuels in most of the world.23 Tellingly, solar electricity generation (by TWh per year) increased 27x over the same time period, while wind increased 4x.24
We expect this growth to continue as economies of scale, greater investment, supportive policies, and market forces lower further reduce the cost of components like wind turbines and photovoltaic cells.25
In most of the world, costs associated with renewable energy are already below coal and gas plant costs, presenting significant incentive to further transition to clean energy. Even Texas, the U.S.’s largest producer of fossil fuels and fastest growing state by population, relies on the cost effectiveness of wind power to meet growing power demands.
By the end of the decade, the cost of solar is expected to fall another 55% – 62%, while costs associated with onshore and offshore wind could fall by 45% and 50% respectively, potentially making the economics of renewable energy even more attractive.26 Additionally, climate-related policies and milestones that include renewables’ share of the energy mix reaching 74% by 2050 to limit warming to 1.5 °C, should add further incentive to transition to clean energy.27
A Deeper Dive: Wind Turbines
Harnessing the wind’s kinetic energy is no novel concept. Windmills have been around for roughly 2,000 years and were first employed to pump water and grind grain into flour. Modern wind power sources, of course, work and look quite differently than the countryside mills of antiquity. Today’s wind farms are comprised of imposing towers topped with turbines. Large blades equipped with wind-sensing technology capture the wind’s kinetic energy and spin a rotor/driveshaft that runs through the turbine’s housing, also called the nacelle. Within the turbine, a gearbox accelerates the rotor’s rotation and a generator uses magnets to create electricity from that motion, ultimately delivering power to the grid.
The lifetime costs of turbines are continuing to fall as innovations in wind blade and turbine technologies improve efficiency, generating more power with less wind. New wind blades with greater length and surface area, for instance, allow for great output when wind speeds are low. 21st century wind tower engineering and autonomous repair robots can also continue to help drive costs down.
A Deeper Dive: Solar Photovoltaic (PV)
The solar panels seen on rooves, in the desert, or even on large rafts at sea consist of photovoltaic cells made of semiconducting material. Typically, this material is polycrystalline silicon, which captures energy through the photovoltaic effect, a process in which light from the sun, or photons, knock electrons on the silicon loose, generating an electric current. For most end-uses, this electricity must run through a solar inverter, a device that converts it to AC power, before consumption. Solar cells and solar inverters are the primary cost components of solar power, aside from installation, and they are getting more affordable as time goes on. Since 2010, economies of scale and innovation in these technologies have driven the total installed cost of solar projects down by 81%.28
The first solar panel was created in 1954 with 4% efficiency, meaning 1/25th of absorbed sunlight would become electricity, while the rest would escape as heat.29 Nearly 70 years later, that efficiency is roughly 20%, a meaningful jump when it comes to cost savings, but still below the theoretical limit of around 30% for single-junction solar cells.30 Multi-junction cells, or those comprised of multiple semiconducting materials, present the opportunity to lower costs even further. These cells have a maximum theoretical efficiency of 87%, but at this point are still early stage.31
Connected, But Distinct Themes: How Renewable Energy Production and CleanTech Differ
While the renewable energy production and cleantech value chains are inherently intertwined, we view these segments as separate investment themes. The renewable energy theme targets companies that generate electricity from sustainable sources, including wind, solar, hydroelectric, geothermal, and bioenergy sources. These companies then sell that electricity at either market or contracted rates. Given these business models, they are typically classified as Utilities companies and share similar characteristics with traditional Utilities, such as lower volatility and more consistent earnings. But while Utilities often pay an above average dividend yield, renewable energy producers often feature lower yields and higher growth prospects.
The CleanTech theme differs from renewable energy producers in that it skews further “upstream,” including companies that manufacture the components used for renewable generation like wind turbines, solar panels and cells, and solar inverters. CleanTech encompasses business activities like renewable installation and maintenance, as well as renewable-enabling activities related to smart grids, storage, electrification, and energy efficiency. It can also include technologies related to carbon capture, use, and storage, which can reduce emissions. Most companies tied to the CleanTech theme are in the Technology and Industrials sectors, and as a result, CleanTech offers more tech-like higher-risk, higher-reward payoffs than renewables.
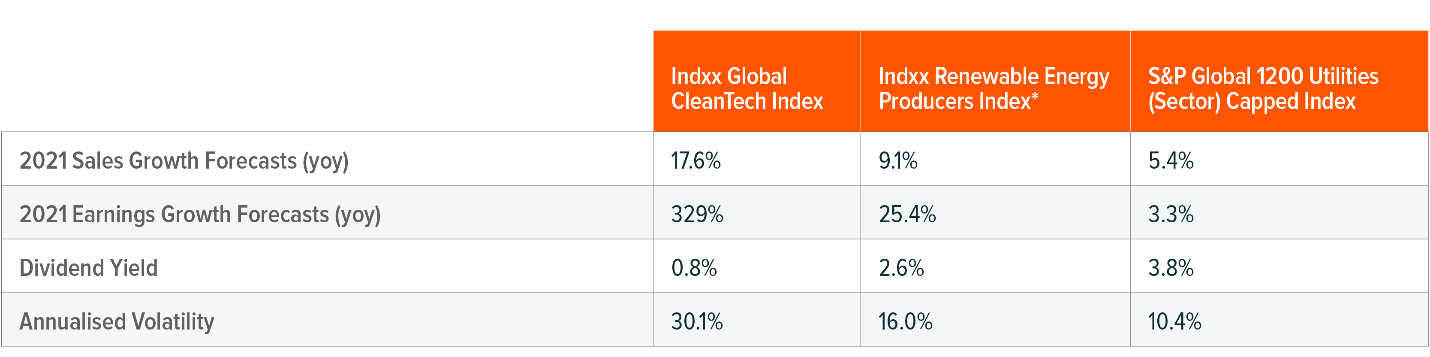 Sources: The sales growth, earnings growth, and dividend yield are from Altavista database; volatility figures are from Indxx and S&P Dow Jones. As of June 23, 2021. *Indxx Renewable Energy Producers Index is different from the Indxx Renewable Energy Producers v2 Index.
There are several potential ways to potentially implement this theme in a portfolio. For sector-based allocations, replacing traditional Utilities exposure in favour of renewable energy production can help improve a portfolio’s growth characteristics without dramatically changing its risk exposures. For sustainably-oriented portfolios, an allocation to renewable energy production instead of traditional Utilities or Energy can help reduce its overall carbon footprint. And finally, for core-satellite portfolios, this theme with its lower volatility could provide some ballast and diversification when joined with allocations to several disruptive tech-focused themes, including CleanTech.
* The IPCC AR6 report referenced in this document refers to the IPCC Working Group I report, the first published instalment of AR6. AR6 is IPCC’s Sixth Assessment Report on the scientific basis of climate change. It is authored by 234 scientists (all of the UN’s 195 member countries can nominate scientists) who summarised and analysed all peer-reviewed climate-science research published through January 2021 (14,000 peer). Prior to publication, the report was subject to its peer review both from the involved scientists and governments to ensure non-partisanship and accuracy.
This document is not intended to be, or does not constitute, investment research