Sustainable Transition: The Opportunity in Solar Power
Planet Earth’s climate is changing for the worse. Human-produced emissions and resulting increases in atmospheric CO2 concentrations are driving long-term temperatures upward, resulting in negative environmental impacts that come with existentially concerning externalities. However, just as human activity bears the onus of our current climate predicament, human innovation and investment could limit it from worsening. Decarbonisation is among the most pressing and globally shared objectives of the 21st century. We can only achieve this by phasing out fossil fuels and accelerating the adoption of clean and renewable energy sources like wind energy. Such a transition will require tens of trillions of dollars of investment in the coming decades, improving the underlying technologies of solar power, among other sources, and solidifying the economic case for a clean energy future.
In the following piece, we investigate the global climate crisis and evaluate the role clean and renewable energy sources like solar power should play in addressing it.
Key Takeaways
- Heightened levels of atmospheric CO2 and related temperature increases threaten lives, livelihoods, and Earth’s natural environment. Limiting warming to 1.5 °C above preindustrial levels through emissions reductions can mitigate many of the negative impacts of climate change.1
- Decarbonisation and phasing out emissions-heavy fossil fuels can be achieved by transitioning to clean and renewable energy sources like solar power. This would entail tens of trillions of dollars of investment in underlying/enabling technologies and incentives, decreasing costs and driving adoption.
- Renewable and clean energy sources like solar power are continuing to gain share on fossil fuel-based sources as related technologies become more affordable. We expect to see continued penetration, driven by electrification, economies of scale, and climate action.
Setting the Stage: The Global Climate Crisis
Temperatures on Earth are reaching new heights. The past four decades were successively hotter than all preceding ones dating back to at least 1850, and the average temperature from 2011-2020 was ~1.09 °C warmer than that of 1850-1900 (preindustrial period).2 Almost all of this warming is the direct result of heightened atmospheric greenhouse gas (GHG) concentrations, primarily of CO2, irrespective of source (human-produced or not).3,4 For the first time in history, the International Panel on Climate Change (IPCC) called this causal relationship “unequivocal” in their landmark 2021 report (AR6).5* GHGs act as atmospheric insulators, absorbing heat from the Earth’s surface and releasing it over time. Naturally occurring GHGs are what kept the planet warm enough for habitation and were regulated by ocean absorption and plant photosynthesis. Today, though, GHG levels are far from natural and the planet cannot keep up.
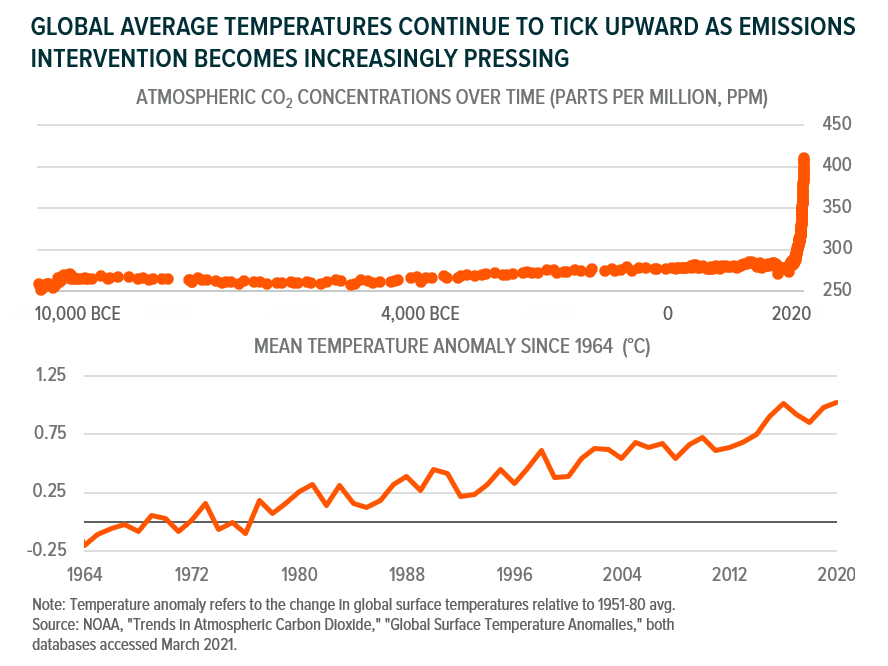
Atmospheric data reveal that the average concentration of CO2 from 2010-2019 was 43% higher than the preindustrial average, increasing from 289.3 parts per million (ppm) to 410 ppm.6 This increase occurred 100x faster than any known natural increase, including the several-thousand year period that ended the most recent ice age.7 And in 2019, CO2 concentrations reached levels higher than at any point in the past 2 million years.8 That this began shortly following the industrial revolution in the 20th century is no coincidence. Anthropogenic (human-produced) emissions are almost solely responsible for heightened GHG levels and resulting temperature increases (+/- 0.1°C to account for the presence/lack of natural GHGs). The burning of fossil fuels for energy is the primary culprit. Since 1990, fossil-fuel energy sources produced 74% of annual CO2 emissions, on average.9,10
The impacts of emissions and warming are already in effect, and all at once:11
- The intensity and frequency of extreme temperatures and heatwaves on land have increased since the 1950s, while ocean heatwaves have doubled since the 1980s.
- Heavy precipitation events have become more frequent and intense since the 1950s. Somewhat counterintuitively, agricultural and ecological droughts have also increased since then as a result of warmer temperatures.
- Over the past 100 years, oceans warmed faster than they did in the 11,000 years prior, resulting in retreating glaciers and melting sea ice. Relatedly, sea levels rose faster than over any comparable time-period in the 3,000 years prior. Oceans are also getting more acidic due to heightened CO2
- Hurricanes have become more frequent over the past 40 years, beyond what can be explained by natural variability. Warmer oceans and rising sea levels make these storms more intense and damaging, also moving them northward as warmer temperatures introduce new breeding grounds.
Connected through the water cycle, among other systems, these impacts are resulting in devastation from natural disasters to water scarcity, and food shortages, all of which threaten lives, livelihoods, and global economies (see our research on Clean Water for related analysis).12 This is just with ~1.1°C of warming. Under the emissions policies in place as of 2021, temperatures in 2100 could fall in the range of 2.1-3.9°C above preindustrial levels.13 Just 2°C of warming would significantly increase the intensity and frequency of extreme “once-every-ten-year” weather events, with extreme heat events occurring 5.6x more often and 2.6°C hotter, extreme precipitation 1.7x more often and 14% wetter, and extreme droughts 2.4x more frequently and 0.6 standard deviations drier (in terms of soil moisture).14 The impact on human life would be immeasurable. Clearly, current interventions are not enough.
*The IPCC AR6 report referenced in this document refers to the IPCC Working Group I report, the first published installment of AR6. AR6 is IPCC’s Sixth Assessment Report on the scientific basis of climate change. It is authored by 234 scientists (all of the UN’s 195 member countries can nominate scientists) who summarised and analysed all peer-reviewed climate-science research published through January 2021 (14,000 peer). Prior to publication, the report was subject to its peer review both from the involved scientists and governments to ensure non-partisanship and accuracy.
Clean & Renewable Energy as a Solution to Climate Change
2016’s Paris Agreement formalised the legally binding goal of limiting warming to well below 2°C warmer than preindustrial levels. The agreement highlights 1.5°C of warming as an achievable objective that would drastically limit the above-mentioned impacts of climate change.
UN-sponsored climate negotiations at the recent COP26 conference resulted in an agreement between nearly 200 nations that builds on the Paris Agreement in key areas.15 This agreement, known as the Glasgow Pact, reaffirms goals set by the Paris Agreement and acknowledges that the world’s climate change efforts must accelerate over the next decade to avoid the worst outcomes. Additionally, the Glasgow Pact acknowledges the central role fossil fuels play in climate change and calls for the phasedown of coal usage.
COP26 yielded several other impactful agreements between smaller groups of attendees. Such agreements include:
- The U.S. and China unexpectedly agreed to boost cooperation on renewable energy generation, developing regulations, and deploying clean technologies.16
- About 450 banks, pension managers, and other firms committed to align 100% of their funds with net-zero emissions targets by 2050. Together these firms command US$130T in assets, enough to address a large portion of necessary clean technology investments.17
About 100 countries agreed to cut methane emissions 30% by 2030.18 Methane contains ~80x more warming potential than carbon dioxide, so curtailing this gas could have the most immediate impact of any of the deals struck at COP26.19
Existing legislation, commitments, and targets would require USUS$98T of total investment between 2021 and 2050, with USUS$10T directed to renewable energy, USUS$13T to renewable energy-enabling electric infrastructure for transportation and heat (see following section for explanation), USUS$32T to energy efficiency technologies, and the remainder to fossil fuels.20 While this is considerable and should benefit companies involved in producing renewable energy and clean technologies in the near- and long-term, acceptable warming paths will likely require substantially more.
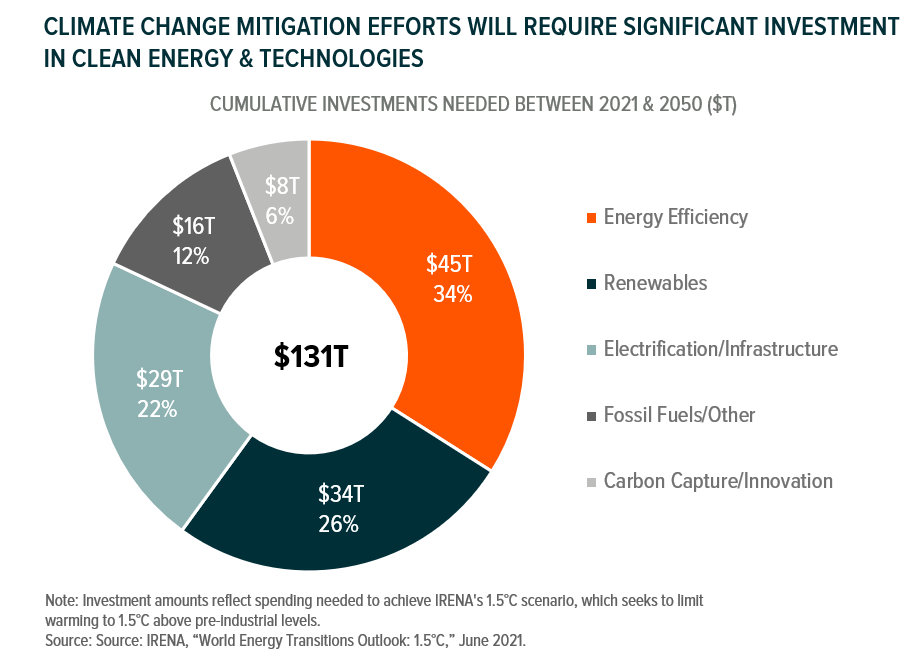
IRENA’s implementation-focused 1.5°C scenario estimates that overall investment should increase to USUS$131T over the same period, significantly increasing the proportions directed to renewable energy and electrification (see chart).21 By 2050, such investment, alongside prudent implementation, could bring net annual emissions down to -0.4 Gigatons of CO2 (GtCO2/yr), a significant improvement from the 36.5 GtCO2/yr that is likely on our current pathway.22
We expect to see investment in renewables and clean technology surpass what current policy suggests, regardless of future government action because many of these technologies make sense from an economic and business standpoint:
- Employment in the renewable energy sector is rapidly growing and should continue to increase as the transition away from fossil fuels continues (see following sections), especially in a world that is still reeling from the COVID-19 pandemic.
- Over 75% of the global population lives in a country that is a net importer of fossil fuels. For these people and countries, renewable energy could provide energy independence.23
- Renewable electricity is becoming cheaper than electricity produced by fossil fuels (see following sections). For this reason and others, companies like Amazon and Walmart, among others, have already announced plans to decarbonise using renewable energy and clean technologies.24
Solar Power: Past & Present
The solar panels (also called modules) that comprise utility-scale solar plants (also called farms), residential installations, and other settings, feature photovoltaic (PV) cells made of semiconducting material. Typically, this material is polycrystalline silicon, which captures energy through the photovoltaic effect, a process in which light from the sun, or photons, knock electrons on the silicon loose, generating an electric current. For most end-uses, this electricity must run through a solar inverter, a device that converts it to AC power before consumption.
Just over a decade ago, when clean energy sources’ share of the power mix was just 10%, hydroelectric sources like dams and run-of-the-river power generators represented the lion’s share of renewable power generation – hydroelectric power represented 82% of all renewable power generation in 2010, while wind and solar power represented just 8.3% and 0.8%, respectively.25 Hydropower alone, however, was never meant to be the sole keystone of a clean energy future. Hydroelectric energy sources are restricted by location and an already-prominent reliance on hydroelectric power limits its growth. From 2010 to 2019, hydroelectric power generation grew by 23%, outpacing the growth of overall energy consumption by 8%, but not growing enough to significantly capture traditional energy source market share on its own.26
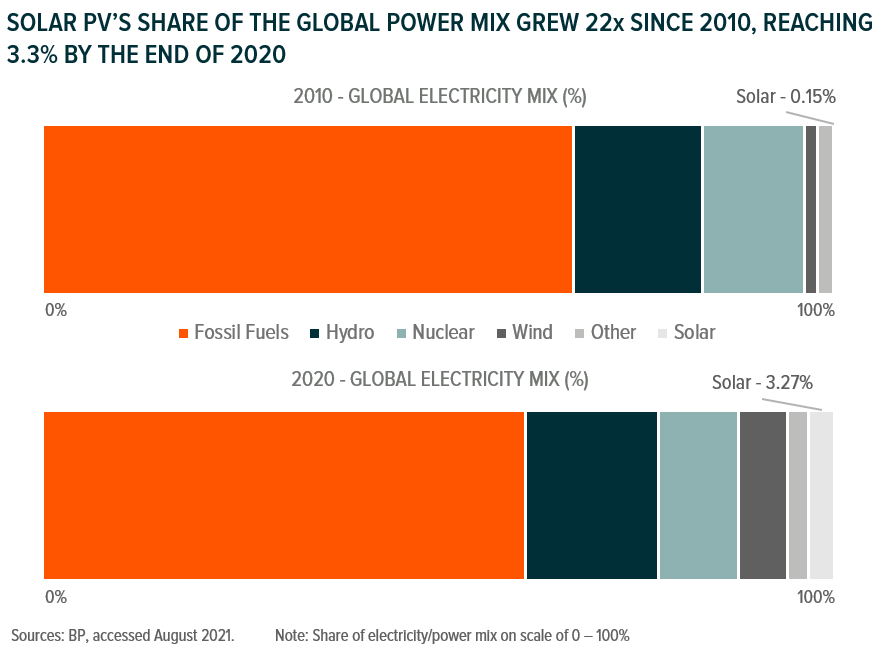
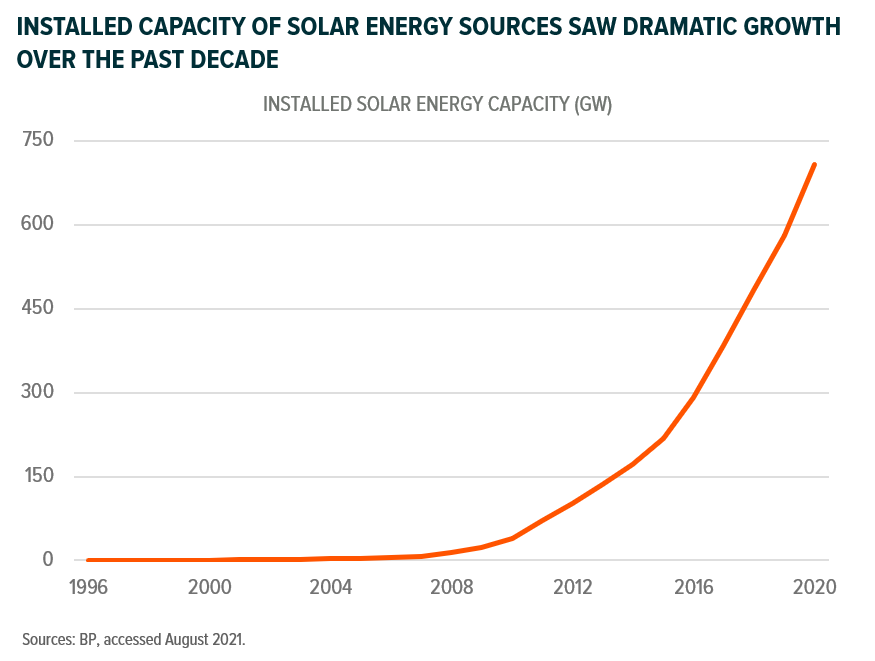
Much has changed since 2010, though, and clean energy sources’ share of global electricity production in the power sector gained significantly, reaching 29% in 2020, 2% more than at the end of 2019 and almost 10% more than at the end of 2010.27 Wind and solar power are proving to be the previously missing pieces to the global transition to renewable energy. Looking at solar power, the installed capacity of solar energy sources increased by 17.6x (1,763%) between 2010 and 2020, from 40.1 gigawatts (GW) to 707.5 GW.28 And today, solar energy sources produce 3.3% of all global electricity, representing 11.5% of renewable power generation.29
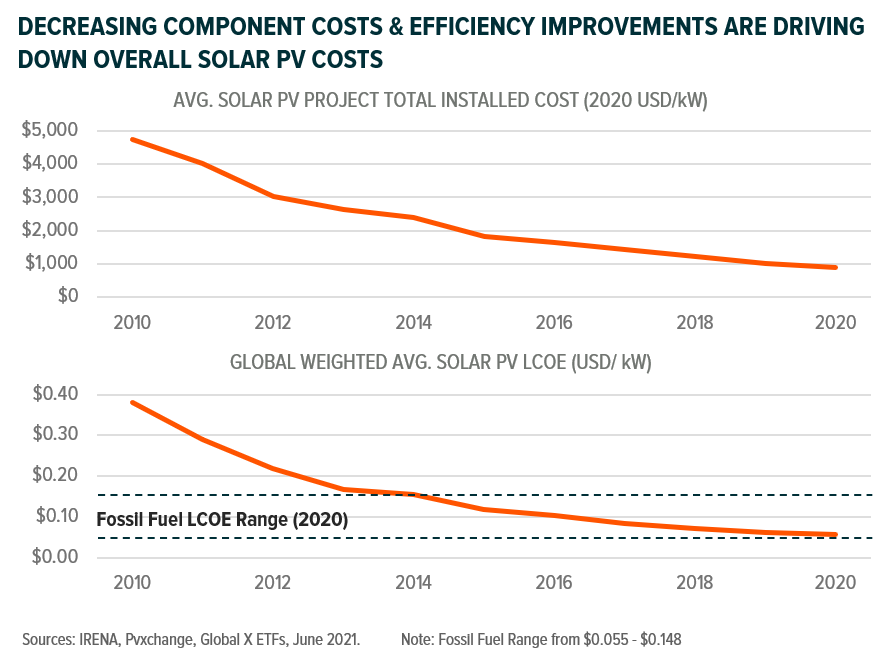
Much of this recent growth can be attributed to innovation and rapidly decreasing costs of underlying technologies. Solar cells and solar inverters are the primary cost components of solar PV, aside from installation, and they are getting more affordable as time goes on. At the end of 2020, the going average price for a solar PV module was US$0.301 per kW versus US$2.73 at the end of 2010.30 This improvement is the result of economies of scale and innovation in these technologies driving the total installed cost of solar projects down by 81% over that period.31 We can contextualise this by looking at the levelised cost of electricity (LCOE) of solar PV, which refers to the revenue required to build and operate a power source over a specified cost recovery period. Over the past ten years, the LCOE of solar PV decreased 85%, making it more affordable than fossil fuels in most of the world.32
What the Future Could Hold for Solar Power
We expect to see continued growth of solar power generation as economies of scale, greater investment, supportive policies, and market forces further reduce the cost of components, installation, and operation of solar power sources. The lifetime costs of solar modules are continuing to fall as innovations in PV cells improve efficiency. The first solar panel was created in 1954 with 4% efficiency, meaning 1/25th of absorbed sunlight would become electricity, while the rest would escape as heat.33 Nearly 70 years later, that efficiency is roughly 20%, a meaningful jump when it comes to cost savings, but still below the theoretical limit of around 30% for single-junction solar cells.34 Multi-junction cells, or those comprised of multiple semiconducting materials, present the opportunity to lower costs even further. These cells have a maximum theoretical efficiency of 87%, but at this point are early stage.35
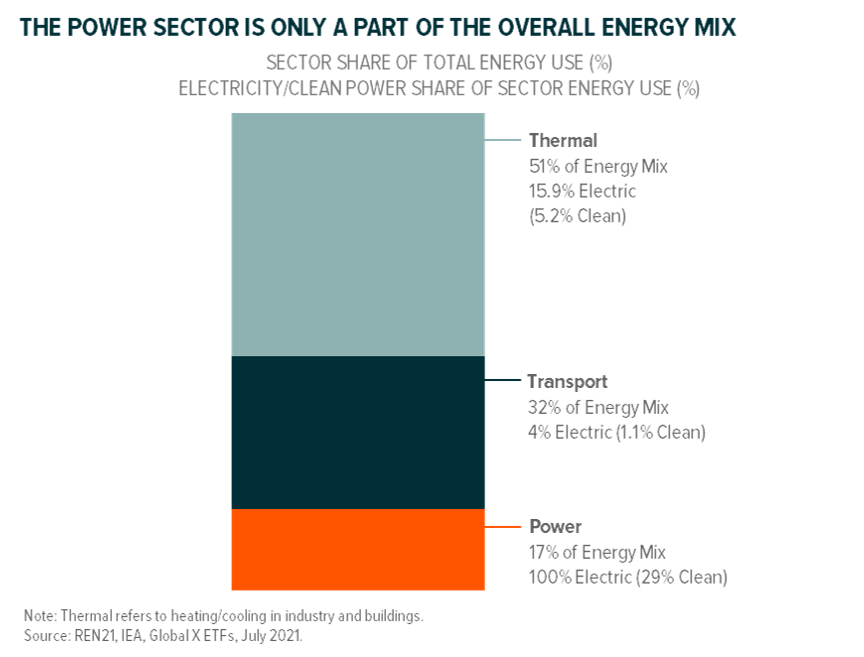
Further, investment in enabling technologies should drive growth for all renewable and clean energy sources. Electricity only represents 37% of total final energy consumption (TFEC), with the majority of this produced directly by the power sector. This means the remaining 63% of TFEC comes from the direct combustion of fossil fuels in transportation, buildings, and industry.36 Electrified end-uses can be decarbonised by transitioning the power sector to renewable energy sources, but for non-electrified end-uses like those just mentioned, decarbonisation is only possible through direct or indirect electrification. Direct electrification entails transitioning away from fossil fuel-powered vehicles and building heating systems to those that run on electric power. With this in mind, renewables and electrification should be viewed as complementary.
Full renewable energy penetration can only be achieved through electrification, while further electrification is very dependent on renewable electricity. Following this thread, further scaling electrification and renewable energy production can play an outsized role in helping achieve global carbon neutrality goals. According to some estimates, substituting fossil-fuels like coal, oil, and natural gas with clean alternative energy sources could reduce emissions by 52% of what is needed to adequately limit warming. 37
Investing in Solar
Addressing climate change through decarbonisation is a critical challenge of our time. The link between human activities is irrefutable and a transition to renewable energy sources like wind and solar is our best hope in achieving this. We are encouraged by the recent adoption of these sources and expect continued market share capture from fossil fuel sources as innovation and decreasing costs further accelerate the transition. We believe investors can participate in the shift toward these sources, while potentially capitalising on the growth of underlying disruptive technologies and the companies offering them.
This document is not intended to be, or does not constitute, investment research